


US Dollar Technical Forecast: Bullish
- The US Dollar put in a big day on Friday following PCE data, setting a bullish engulfing pattern that keeps the door open for continuation into next week.
- Next week is loaded for US markets with both FOMC and NFP on the docket with the Fed expected to announce a start to tapering asset purchases.
- The analysis contained in article relies on price action and chart formations. To learn more about price action or chart patterns, check out our DailyFX Education section.

Next week brings the Fed followed by NFP, so it looks to be a really big week for financial markets around the world and especially in the US.
The wide expectation at this point is for the Fed to announce a start to tapering asset purchases, but the bigger question is what else they might say, specifically pointing at rate policy in the near-term as markets have run away from the bank’s prior projections. And with inflation remaining strong, illustrated by the Friday read of PCE coming in at 4.4%, there’s no wonder that markets have started to question the ‘transitory’ narrative that’s been pushed by the bank for much of this year.
In the US Dollar, the currency has pushed up to a fresh weekly high after a bearish tilt showed in the first four days of last week’s price action. From the weekly chart below, we can see prices responding above the bullish trendline, showing a bullish engulf pattern that will often be followed with the aim of bullish continuation.
US Dollar Weekly Price Chart
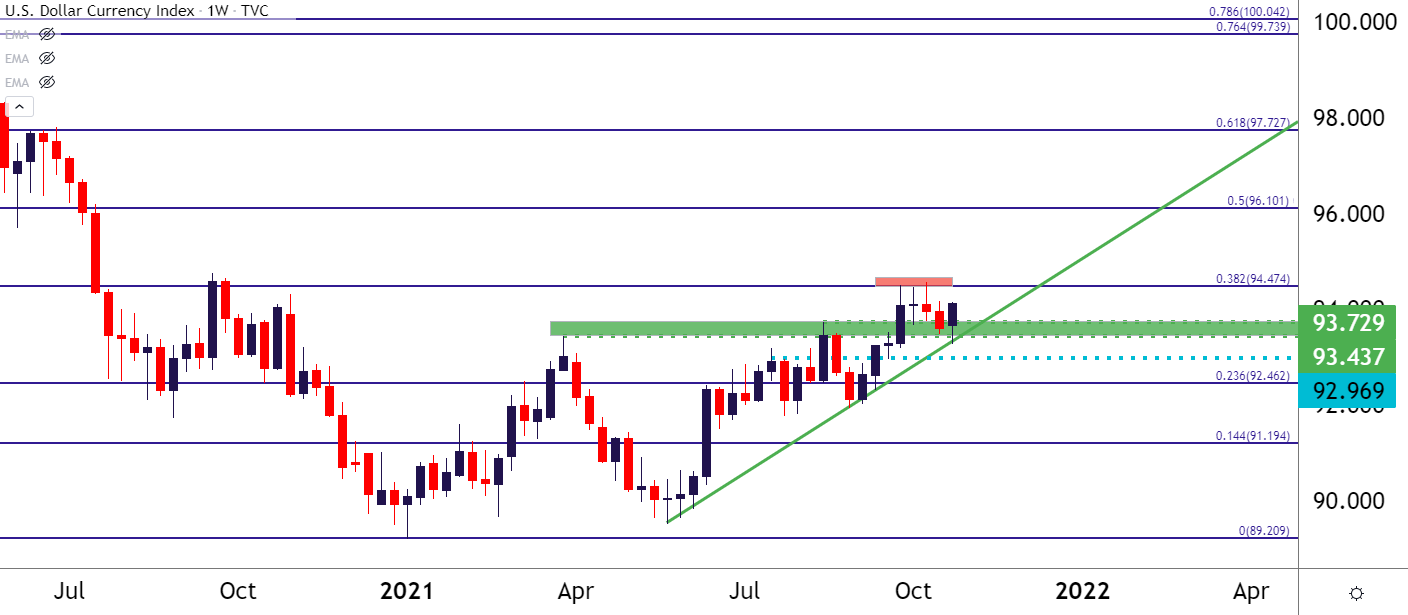
Chart prepared by James Stanley; USD, DXY on Tradingview
EUR/USD Splashes Lower
It was a generally positive week for the Euro until Friday came along. The single currency was smashed after Euro inflation numbers were released. And the combination of the ECB’s comments on Thursday and the inflation print on Friday, which saw YoY come in at 3.7%, there was a pretty clear deviation between the US and Euro outlays and that deviation was priced back-in as EUR/USD slid back down to a fresh weekly low.
Longer-term, there is some bullish potential here, as shown by a falling wedge formation. But those formations are more pertinent for price rather than time, and if EUR/USD can continue the Friday descent into next week, and breach the 1.1448 level, that formation can quickly be negated.
This week’s weakness was intense and it looks like EUR/USD may soon be probing the 1.1448-1.1500 support zone before too long, and the next big zone to come into the equation is in the vicinity of the 1.1200 handle.
EUR/USD Weekly Price Chart
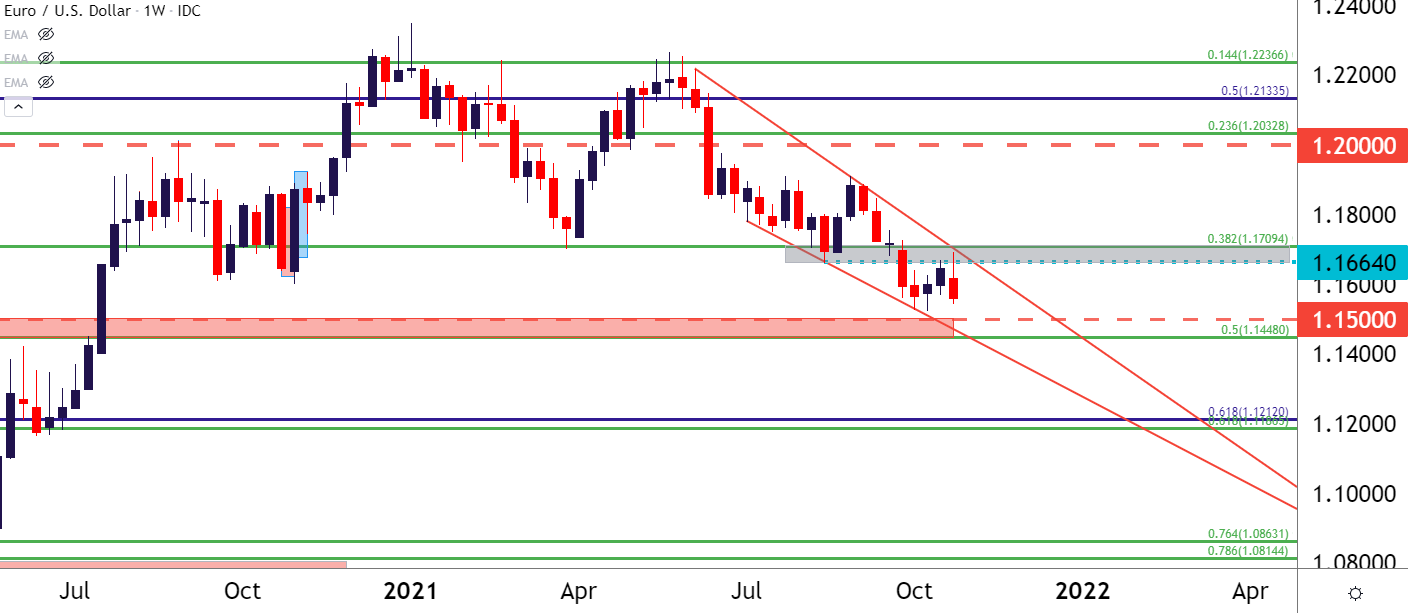
Chart prepared by James Stanley; EURUSD on Tradingview
GBP/USD Bull Flag
Another setup that could denote eventual USD weakness can be seen in GBP/USD. The pair is currently showing a bull flag formation on the weekly chart and there was a very decent amount of grind at resistance of 1.3835 this week.
Interestingly, the UK may actually see faster rate hikes than the US yet the US currency continues to outpace the Pound, at least for now. This highlights how a pair like EUR/GBP may be conducive for some downside, playing off of the additional weakness that had shown in the above setup.
In GBP/USD, that bull flag is going to have to wait for a test of that 1.3835 level before that door can be re-opened. The weekly chart in GBP/USD is currently showing as an evening star formation after this week’s resistance test, and this keeps the door open for a move down towards the 1.3575 level, after which the 2021 low comes into view at 1.3412.
GBP/USD Weekly Price Chart

Chart prepared by James Stanley; GBPUSD on Tradingview
AUD/USD: Want to Fade USD – Look to AUD/USD
For those that do want to fade this run of USD strength, AUD/USD could be an interesting setup. The Australian Dollar has been extremely strong of late, setting another fresh three-month-high just yesterday. The pair did get caught around the .7550 level, but perhaps more noteworthy is the fact that it’s continued to hold above the .7500 big figure, even as US Dollar strength was all the rage.
AUD/USD Daily Price Chart

Chart prepared by James Stanley; AUDUSD on Tradingview
USD/JPY for Rates, USD Strength Themes
The long side of USD/JPY has been especially interesting as the rates theme has come back to life, and this has some parallels to the Q1 outlay in the pair. I had noted this shortly after the September FOMC rate decision, and that theme has largely continued to run.
The rationale for the move is driven by higher rates in the US, which helps to drive the carry trade. As US rates move higher and higher, the motivation for being on the long side of USD/JPY increases as the rate deviation continues to grow. And with the Fed on the docket for next week, this is a theme that can remain on the move.
From the eight-hour chart below, we can see where USD/JPY has built in a falling wedge pattern after coming very close to the 114.74 resistance that I’ve been following. This keeps the pair looking higher with bullish potential, with current resistance showing around the 114.00 handle keeping open the possibility of a top side breakout to 115.00 psychological level and beyond.
USD/JPY Eight-Hour Price Chart

Chart prepared by James Stanley; USDJPY on Tradingview
--- Written by James Stanley, Senior Strategist for DailyFX.com
Contact and follow James on Twitter: @JStanleyFX


