


Talking Points:
- GBP/JPY has continued to hold support at a trend-line produced from the lows in the pair after the bearish run produced by the Brexit referendum. That trend-line of support first started to re-engage with lows last week, and over the past two trading days we’ve seen price action taper around that trend-line projection.
- This has been far from a bullish scenario, however, as short-term price action has continued to exhibit a bearish tonality; marked by a test of resistance this week around a prior area of swing support. This puts GBP/JPY in an interesting spot as we approach the weekend.
- Are you looking to improve your trading approach? Check out Traits of Successful Traders. And if you’re looking for an introductory primer to the Forex market, check out our New to FX Guide.
If you’re looking for longer-term analysis on GBP, JPY or the US Stocks, click here for our Trading Forecasts.
GBP/JPY Holds Support at Post-Brexit Trend-Line
Last week saw price action in GBP/JPY finally exhibit some element of support after a rather aggressive sell-off had developed in the first half of February. Coming into the month, prices in the pair had surged up to a fresh post-Brexit high of 156.61; but in short order, a reversal had started to show off of a key level of resistance, bringing that bearish run in the first half of February.
But last week saw buyers show-up at an interesting spot, with a bounce developing around a trend-line projection that encapsulates the post-Brexit lows in the pair. That support has held so far, including two additional tests this week; but the lack of bullish response may be telling for the next wave of price action in the pair.
GBP/JPY Daily Chart: Post-Brexit Trend-Line Continues to Hold the Lows
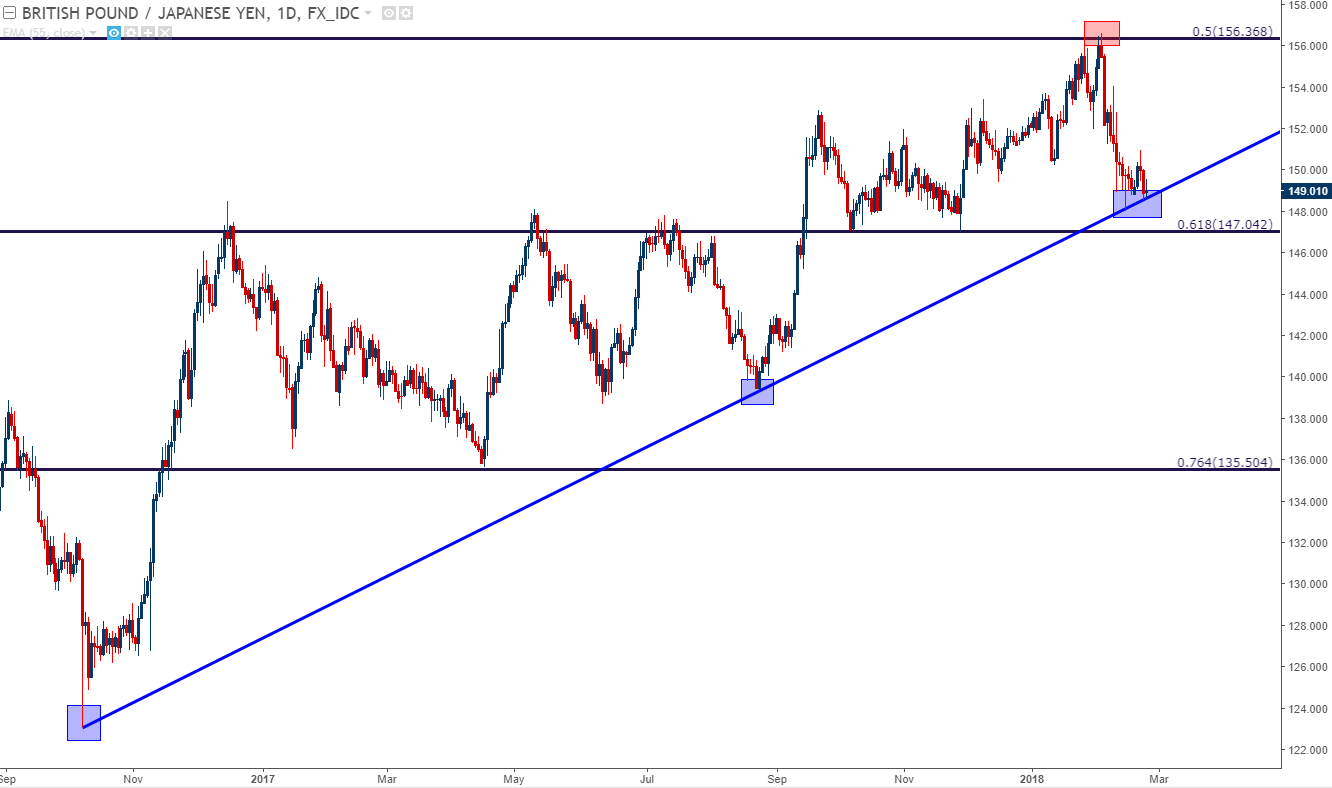
Chart prepared by James Stanley
Bulls Aren’t Exactly Getting Excited Here
The disconcerting part of the above chart, at least for bulls, is what happened after that support began to face tests. While it’s held, buyers haven’t exactly been able to take-control of matters, and this has led to a series of lower-highs, including a resistance test off of the ‘r2’ level that we looked at last week around 150.81. This swing around 150.81 syncs up with a prior swing-low, indicating some level of continued pessimism around the pair.
GBP/JPY Hourly Chart: Support From Trend-Line Projection, Resistance from Prior Swing-Low
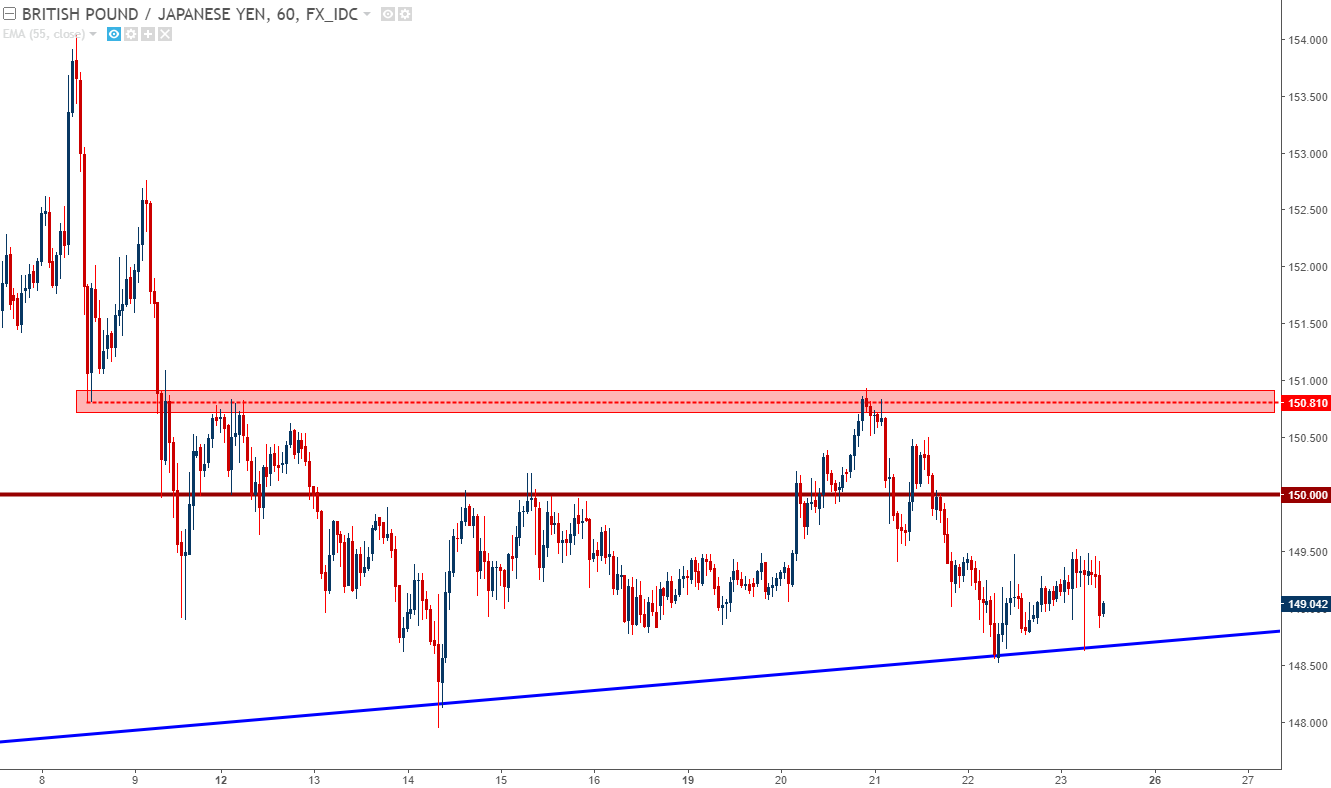
Chart prepared by James Stanley
Moving Forward
The above combination of longer-term support to go along with near-term bearish-drive makes for a complicated picture around the pair as we move towards next week. Rather than try to push a square peg into a round hole in which the setup simply isn’t there, traders can wait for the pair to move to more attractive levels before looking to establish exposure.
On the short-side of GBP/JPY, this could be looked at around the 150.00 level in the effort of establishing lower-high resistance in which stops can be placed over this week’s swing-high. This would allow for initial targets around current levels around 149.00; but if we do get that trend-line break, the door could open to significantly more.
On the bullish side, traders may want to be careful of acting on this trend-line as its getting rather well-worn, and instead cast bullish outlooks in one of two directions: Either look for deeper support around the 147.04 level: This is the 61.8% Fibonacci retracement of the same move that helped to carve out the post-Brexit high at the 50% marker. Or, alternatively, a break-above this week’s high can show that bulls have won out after this battle at trend-line support.
GBP/JPY Daily Chart
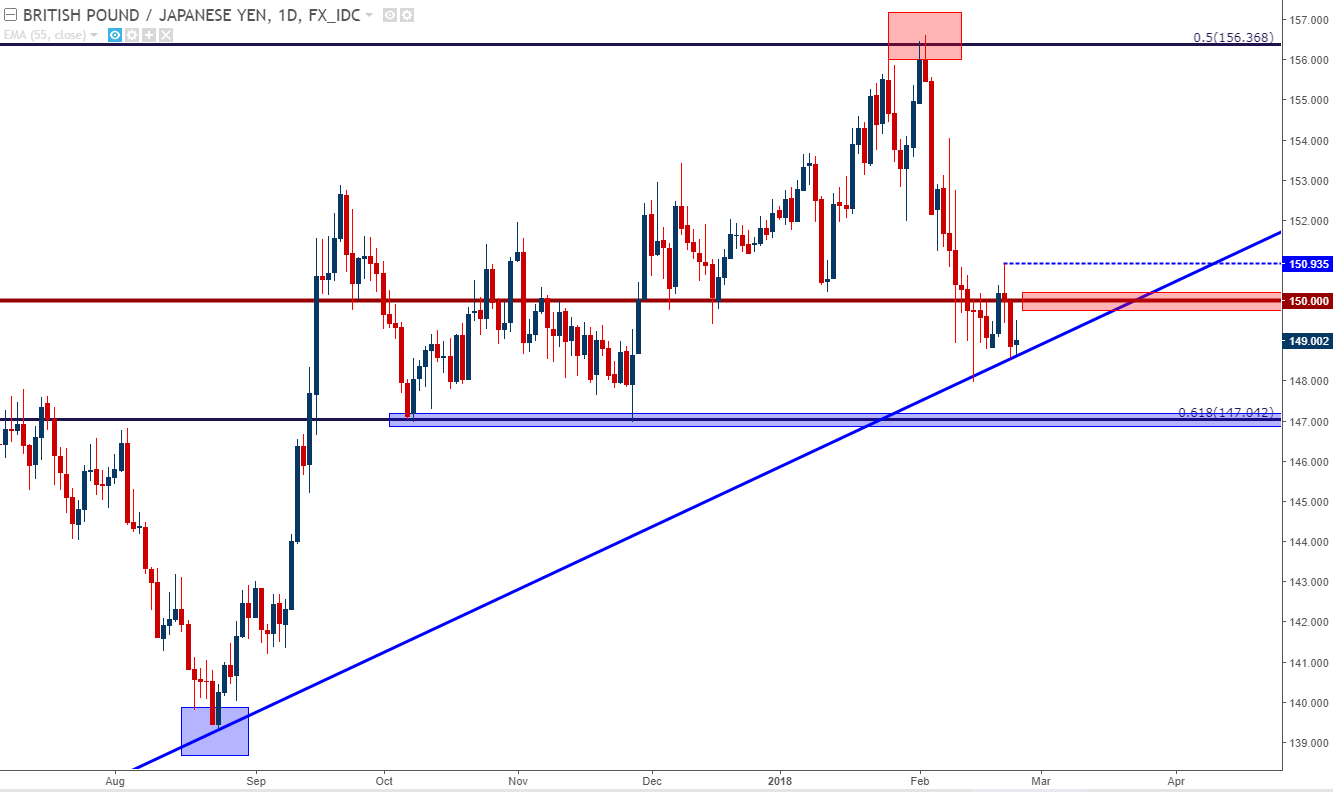
Chart prepared by James Stanley
To read more:
Are you looking for longer-term analysis on GBP and/or JPY? Our DailyFX Forecasts for Q1 have a section specifically for each currency. We also offer a plethora of resources on our GBP/JPY page, and traders can stay up with near-term positioning in GBP/USD and USD/JPY via our IG Client Sentiment Indicator.
--- Written by James Stanley, Strategist for DailyFX.com
To receive James Stanley’s analysis directly via email, please SIGN UP HERE
Contact and follow James on Twitter: @JStanleyFX


