


DAX 30/CAC 40 Technical Highlights
- DAX 30 broke out of range, very near ATH created in 2018
- CAC 40 closing in on the peak from 2007 at 6168
For fundamental and technical forecasts, trade ideas, and educational guides, check out the DailyFX Trading Guides page.
DAX 30 broke out of range, very near ATH created in 2018
Today’s breakout from congestion has the DAX heading where it hasn’t been since January 2018, all-time-highs situated at 13596. While a break on through will likely lead to even higher prices, risk/reward may become quickly unfavorable as a correction near shortly upon a new record. Buying at current levels, without resistance having been crossed yet, means longs should still tread with some caution. Short trades hold little appeal at the moment.
The top of the recent range at ~13425 should act as support on a small retracement, but even if it doesn’t hold it may only hold a short-term bearish tilt as trend support from August has recently proven sturdy. To turn the picture bearish at this time we will need to see a decline below the trend-line. Otherwise, the chart will remain bullish for the foreseeable future.
DAX 30 Daily Chart (very near ATH)

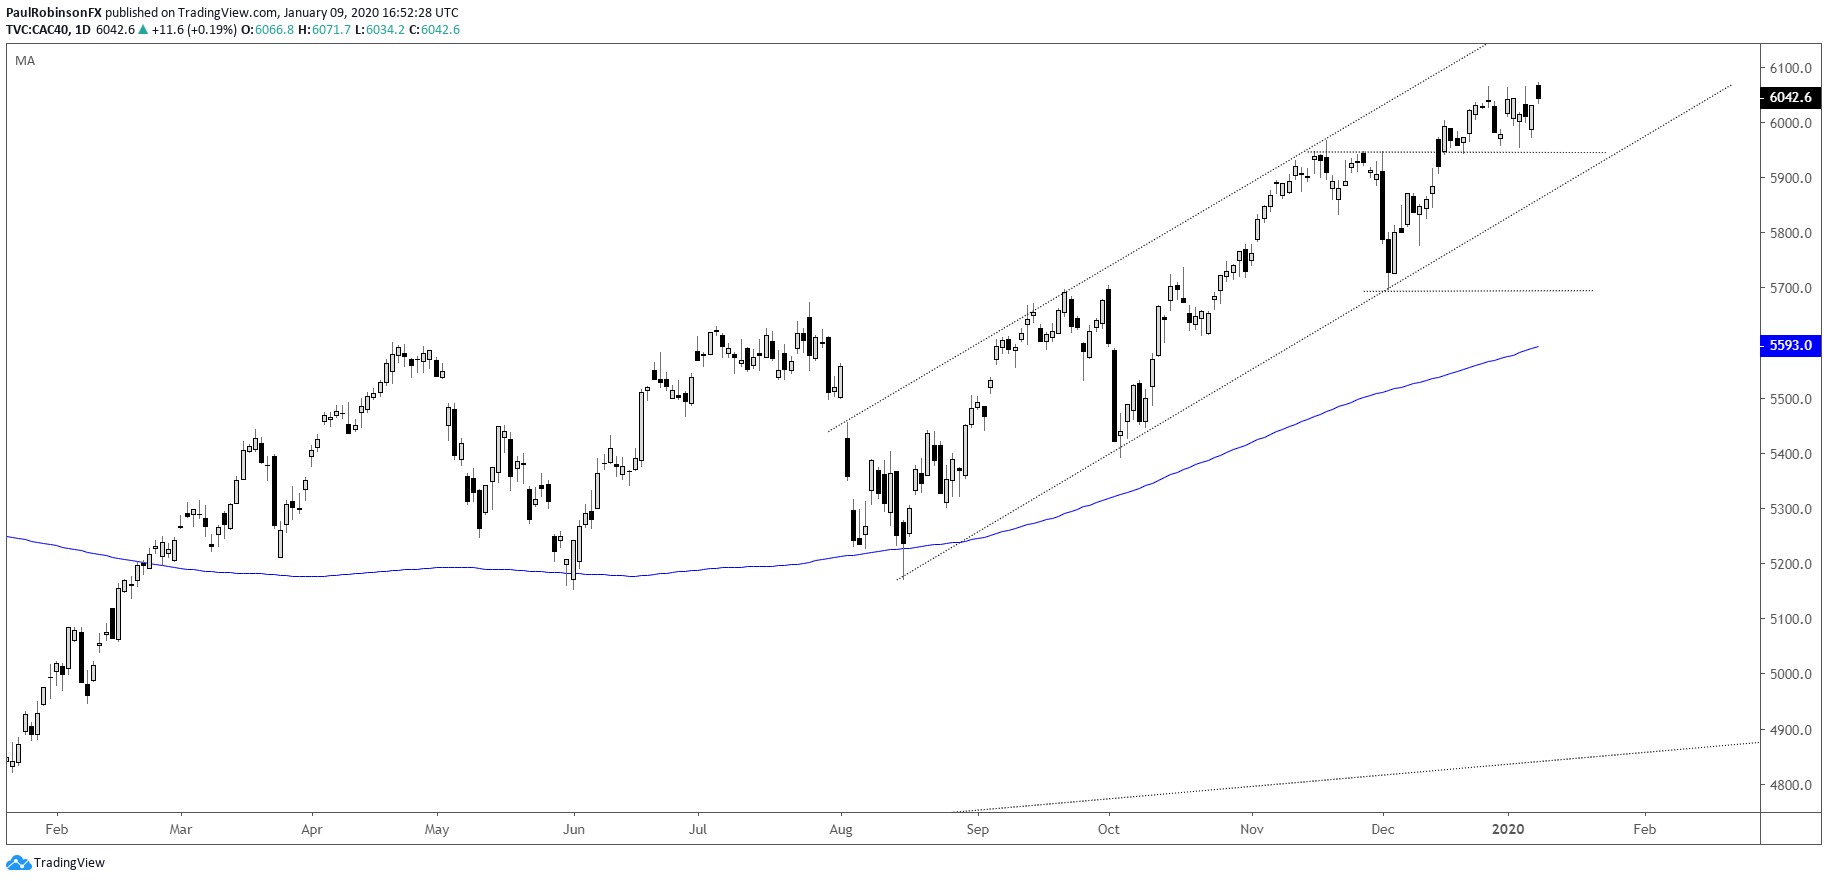
CAC 40 closing in on the peak from 2007 at 6168
The CAC 40 has been working its way higher in a bullish fashion since undergoing a corrective period during the middle of last year. The channel it has been creating is impressive, running the price higher in steady fashion. Today, the CAC broke out slightly from a short-term range, but isn’t gaining much momentum out of the gate yet.
With a little more push, the 2007 high at 6168 will be met. Like the DAX, the trend-line (lower parallel of the channel off the August low) will remain a significant trend threshold should we see weakness. As long as price doesn’t sink below, then the trend remains intact. Break below? Then we can discuss a reversal scenario.
CAC 40 Daily Chart (eyes for 2007 high, 6168)
Want to learn more about trading the DAX? Check out ‘How to Trade the DAX’, and join me weekly for technical updates in the Indices and Commodities webinar.
Forex & CFD Trader Resources
Whether you are a new or experienced trader, we have several resources available to help you; indicator for tracking trader sentiment, quarterly trading forecasts, analytical and educational webinars held daily, trading guides to help you improve trading performance, and one specifically for those who are new to forex.
---Written by Paul Robinson, Market Analyst
You can follow Paul on Twitter at @PaulRobinsonFX


