


Australian Dollar Technical Price Outlook: Near-term Trade Levels
- Australian Dollar technical trade level update – Daily & Intraday Charts
- AUD/USD sets weekly opening-range below resistance at 7321
- Risk for further losses sub-7372 – Near-term support 7266
The Australian Dollar is up more than 0.8% against the US Dollar since the start of the week with AUD/USD now probing resistance near multi-week highs. We’re on the lookout for inflection off this region with the immediate advance vulnerable while below the yearly high-day close. These are the updated targets and invalidation levels that matter on the AUD/USD price charts. Review my latest Strategy Webinar for an in-depth breakdown of this Aussie setup and more.
Australian Dollar Price Chart – AUD/USD Daily
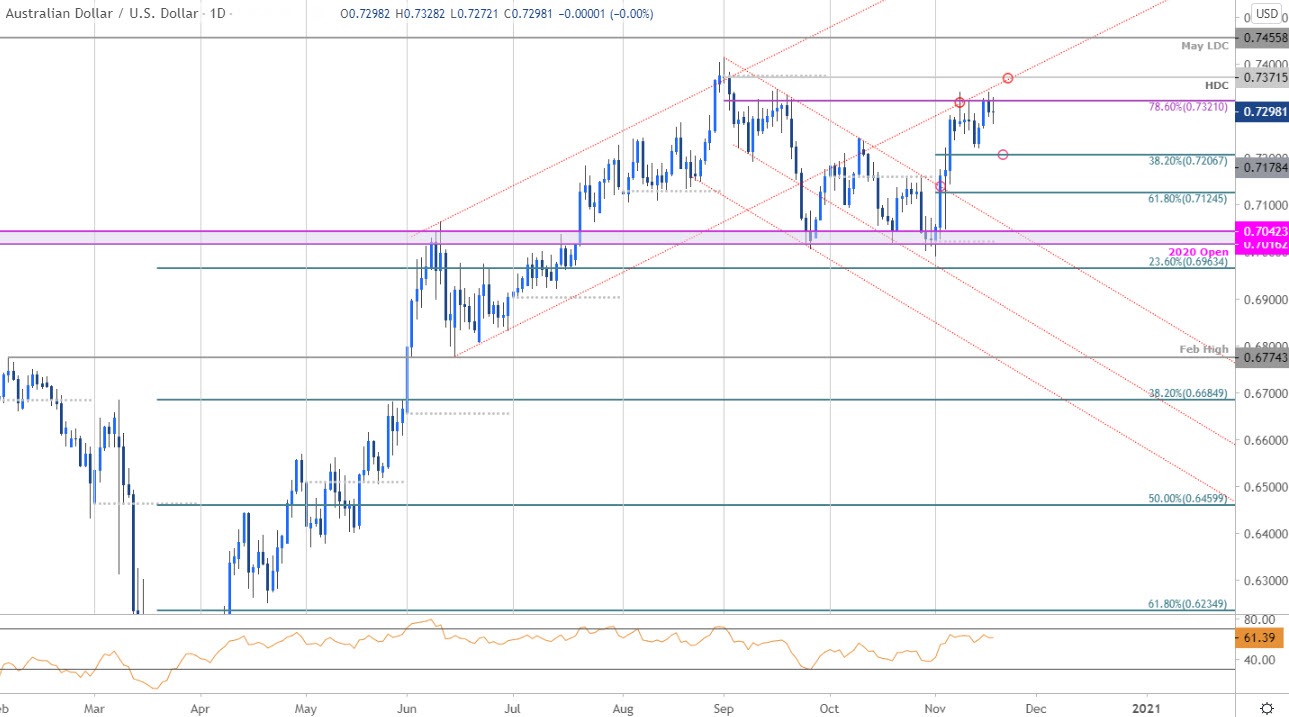
Chart Prepared by Michael Boutros, Technical Strategist; AUD/USD on Tradingview
Technical Outlook: In last month’s Australian Dollar Price Outlook we noted that AUD/USD was carving a, “weekly opening-range just below the monthly open / downtrend resistance – look to the breakout for guidance.” A topside breach into the November open fueled a price breakout with Aussie now trading back into confluence resistance at former channel support / 78.6% retracement at 7321. Note that building momentum divergence into this last stretch highlights the threat to the immediate rally here.
Key daily resistance is eyed just higher at the yearly high-day close at 7372- a breach / close above this threshold is needed to mark resumption of the broader uptrend with such a scenario likely to fuel an accelerated advance towards the yearly highs and the May 2018 low-day close at 7455. Initial daily support rests 7207 backed by the 38.2% Fibonacci retracement of the September decline at 7125- look for a more larger reaction there for guidance IF reached.
Australian Dollar Price Chart – AUD/USD 120min
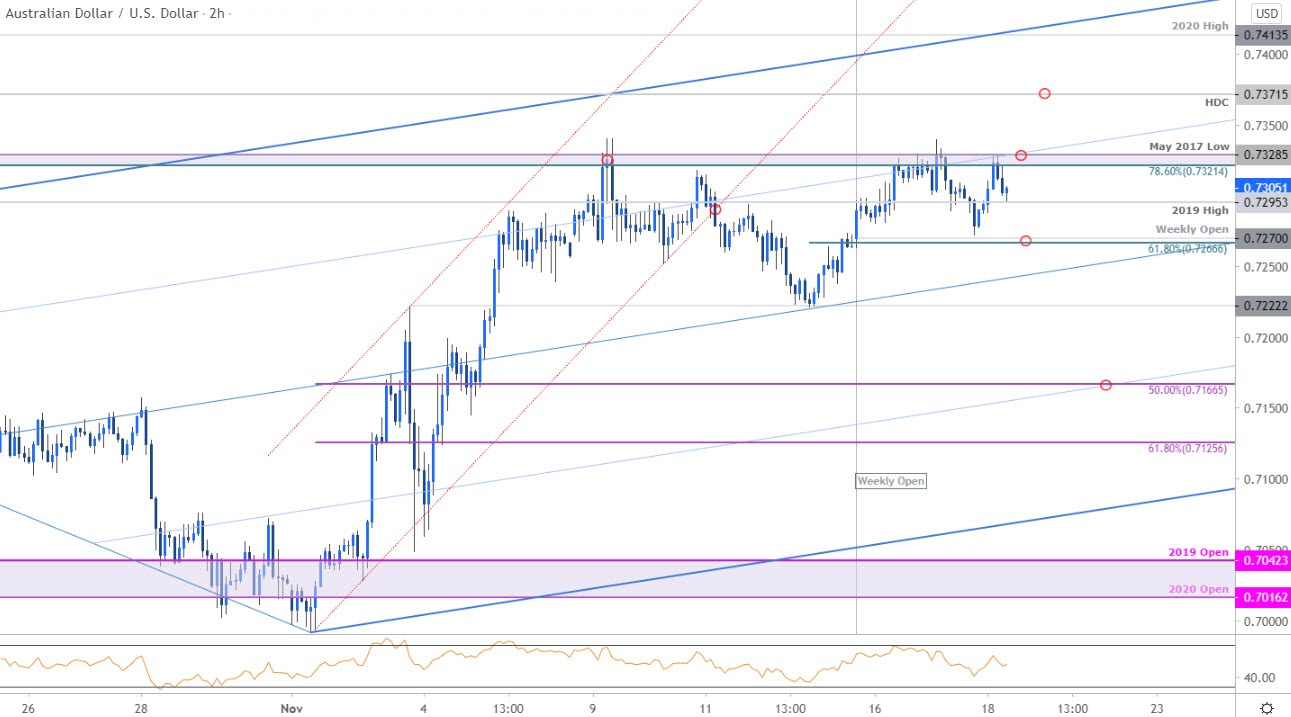
Notes: A closer look at Aussie price action shows AUD/USD trading within the confines of an ascending pitchfork formation extending off the September / November lows with price setting the weekly opening-range just below the 75% parallel / confluence resistance at 7321/29. Initial support rests at the 2019 high at 7295 backed by 7266- a break below 7222 would be needed to shift the near-term focus lower towards 7166 and 7125. A breach higher from here exposes 7372 backed by the yearly high at 7414 and the upper parallel / May low-day close at 7455.

Bottom line: Australian Dollar has set the weekly opening-range just below resistance – look to the break for guidance. From at trading standpoint, a good region to reduce long-exposure / raise protective stops – be on the lookout for possible topside exhaustion with the immediate advance vulnerable while below September the high-day close. Ultimately, a break below this near-term formation would be needed to shift the medium-term focus in Aussie. Review my latest Australian Dollar Weekly Price Outlook for a closer look at the longer-term AUD/USD technical trade levels
For a complete breakdown of Michael’s trading strategy, review his Foundations of Technical Analysis series on Building a Trading Strategy
Australian Dollar Trader Sentiment – AUD/USD Price Chart
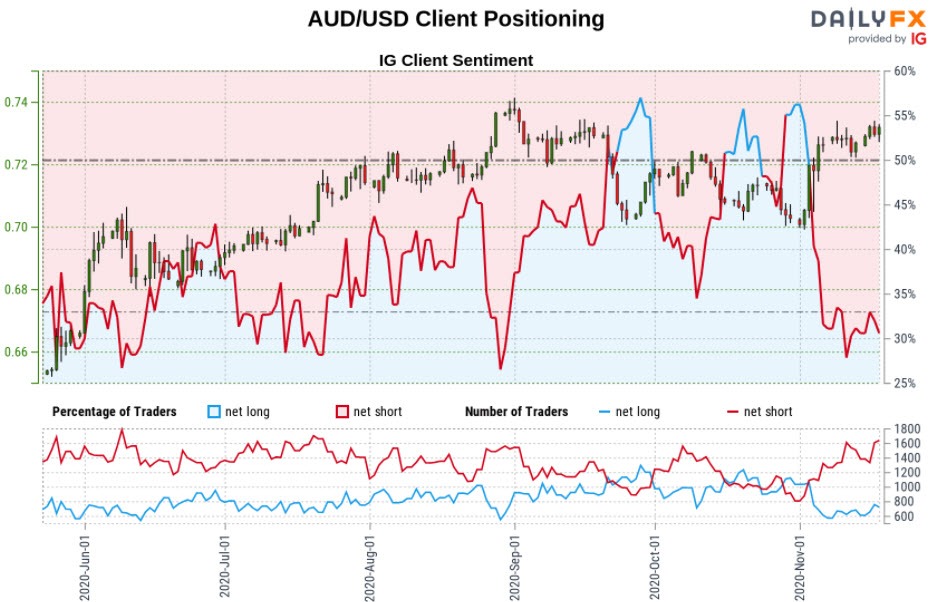
- A summary of IG Client Sentiment shows traders are net-short AUD/USD - the ratio stands at -2.21 (31.20% of traders are long) – bullish reading
- Long positions are 3.87% lower than yesterday and 4.19% higher from last week
- Short positions are0.06% lower than yesterday and 3.92% higher from last week
- We typically take a contrarian view to crowd sentiment, and the fact traders are net-short suggests AUD/USD prices may continue to rise. Traders are more net-short than yesterday but less net-short from last week. The combination of current positioning and recent changes gives us a further mixed AUD/USD trading bias from a sentiment standpoint.
| Change in | Longs | Shorts | OI |
| Daily | 2% | 3% | 2% |
| Weekly | 29% | -46% | 0% |
---
Key Australia / US Data Releases
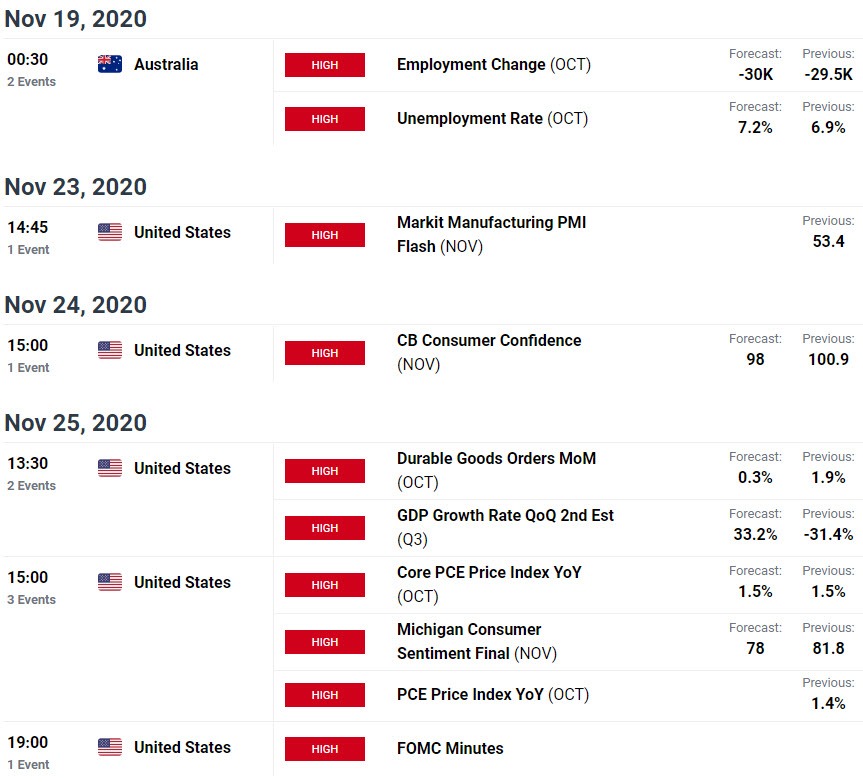
Economic Calendar - latest economic developments and upcoming event risk.
Active Technical Setups
- Gold Price Outlook: XAU/USD Vaccine Sell-off Tests Key Support Zone
- Sterling Forecast: Cable Caught by Uptrend Resistance- GBP/USD Levels
- Euro Outlook: EUR/USD Breakout Fails Resistance- Election Rally Over?
- Mexican Peso Outlook: USD/MXN Election Reversal to Multi-Month Low
- Canadian Dollar Outlook: USD/CAD Spills into Support- Election Levels
- Written by Michael Boutros, Currency Strategist with DailyFX
Follow Michael on Twitter @MBForex


