


Australian Dollar Technical Price Outlook: AUD/USD Weekly Trade Levels
- Australian Dollar technical trade level update - Weekly Chart
- AUD/USD rally testing key technical confluence zone / multi-year downtrend resistance
- Aussie recovery vulnerable near-term sub-7329 – key support steady at 7016
The Australian Dollar virtually unchanged against the US Dollar this week after a 4% rally in AUD/USD failed at a key technical confluence / multi-year downtrend resistance. The bulls are on notice with the post- election rally vulnerable heading into the close of the week. These are the updated targets and invalidation levels that matter on the AUD/USD weekly price chart. for an in-depth breakdown of this Aussie trade setup and more.
Australian Dollar Price Chart – AUD/USD Weekly
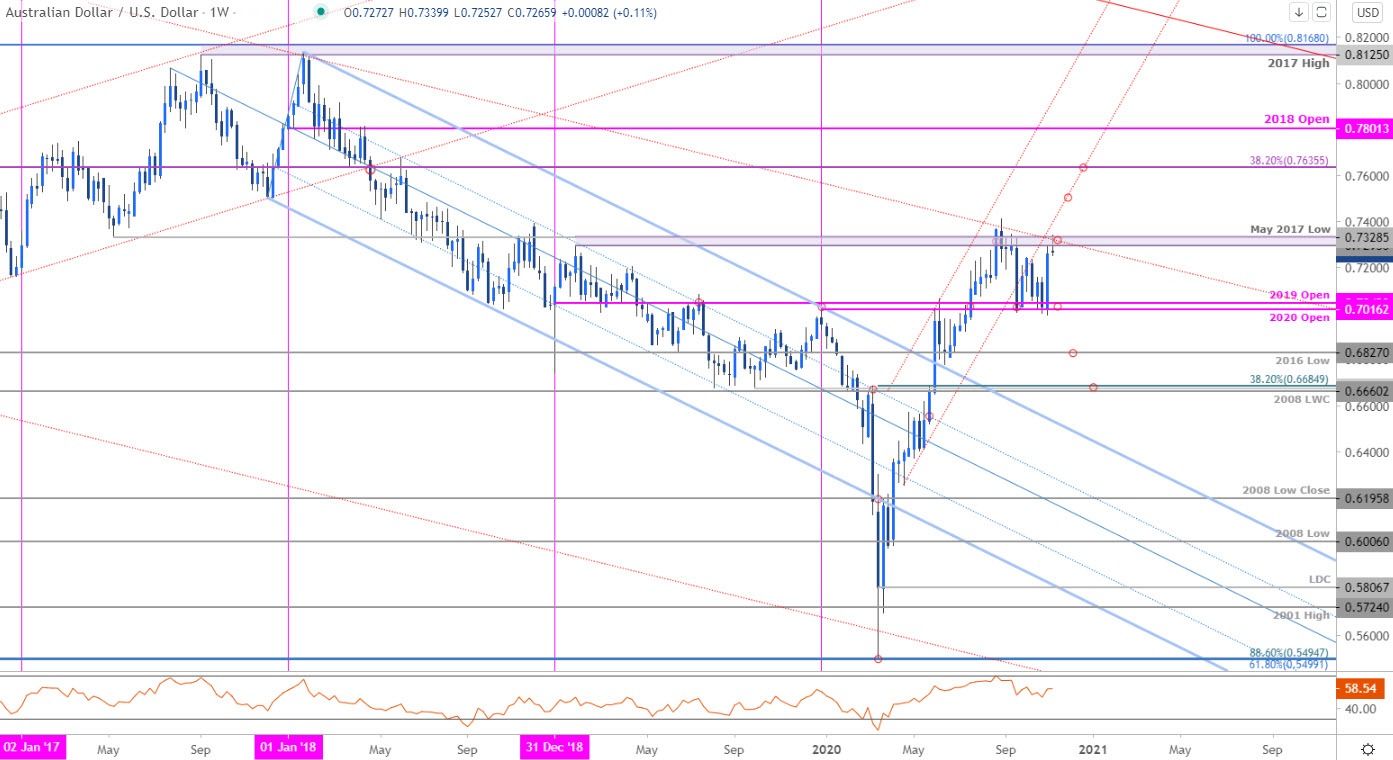
Chart Prepared by Michael Boutros, Technical Strategist; AUD/USD on Tradingview
Notes: In my last Australian Dollar Weekly Price Outlook we noted that Aussie was, “testing a critical support zone and we’re looking for inflection,” as price approached the 2020/2019 objective yearly opens at 7016/42. Price continued to test this threshold for the following two weeks with an outside-weekly reversal candle off the lows last week taking Aussie back into critical resistance at the 2019 high / May 2017 low at 7295-7329.
Note that a parallel of the 2011 resistance trendline extending off the 2018 highs also converges on this zone over the next few weeks and further highlights its technical significance. The immediate advance may be vulnerable while below this threshold with a topside breach / weekly close above needed to keep fuel the next leg higher in price towards former channel support near ~7500 and the 38.2% Fibonacci retracement of the 2011 decline at 7635. A break of this week’s low risks a larger correction in the Australian Dollar with such a scenario exposing the 2016 low at 6827 and the 2008 low-week close / 38.2% retracement of the yearly range at 6660/85.

Bottom line: The Australian Dollar is testing a key technical confluence at multi-year downtrend resistance – elevated risk for inflection off this threshold with the post-election rally vulnerable while below. From a trading standpoint, a good zone to reduce long-exposure / raise protective stops – the immediate focus is on a break of the 7016-7329 range for guidance on our medium-term outlook. Review my latest Australian Dollar Price Outlook for a closer look at the near-term AUD/USD technical trade levels.
For a complete breakdown of Michael’s trading strategy, review his Foundations of Technical Analysis series on Building a Trading Strategy
Australian Dollar Trader Sentiment – AUD/USD Price Chart

- A summary of IG Client Sentiment shows traders are net-long AUD/USD - the ratio stands at -2.21 (31.14% of traders are long) – bullishreading
- Long positions are 0.42% higher than yesterday and 12.15% lower from last week
- Short positions are9.47% higher than yesterday and 79.07% higher from last week
- We typically take a contrarian view to crowd sentiment, and the fact traders are net-short suggests AUD/USD prices may continue to rise. Traders are further net-short than yesterday and last week, and the combination of current positioning and recent changes gives us a stronger AUD/USD-bullish contrarian trading bias from a sentiment standpoint.
| Change in | Longs | Shorts | OI |
| Daily | 2% | 3% | 2% |
| Weekly | 29% | -46% | 0% |
---
Key Australia / US Data Releases
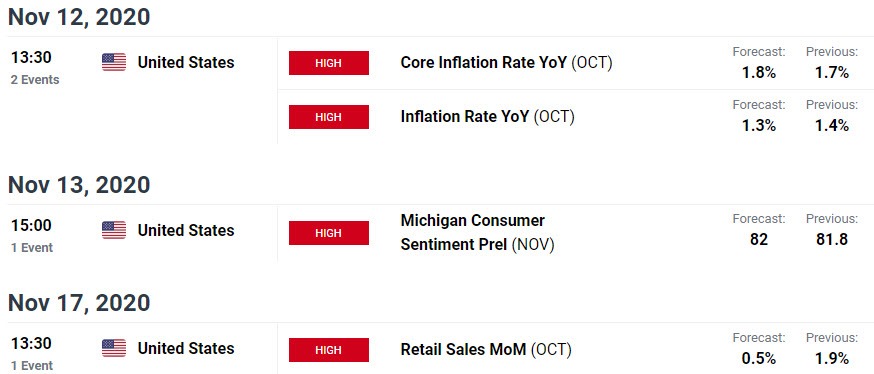
Economic Calendar - latest economic developments and upcoming event risk.
Previous Weekly Technical Charts
- US Dollar (DXY)
- Euro (EUR/USD)
- Gold (XAU/USD)
- Japanese Yen (USD/JPY)
- British Pound (GBP/USD)
- Canadian Dollar (USD/CAD)
--- Written by Michael Boutros, Technical Currency Strategist with DailyFX
Follow Michael on Twitter @MBForex


