


Australian Dollar Technical Price Outlook: AUD/USD Weekly Trade Levels
- Australian Dollar technical trade level update - Weekly Chart
- AUD/USD breakout testing multi-year trend resistance
- Aussie constructive while above 7016- Key resistance at 7328
The Australian Dollar is up nearly 1% against the US Dollar since the start of the week with an eight-week rally taking AUD/USD into critical, multi-year downtrend resistance. Can Aussie muster a ninth weekly advance through key technical resistance? These are the updated targets and invalidation levels that matter on the AUD/USD weekly price chart. Review my latest Weekly Strategy Webinar for an in-depth breakdown of this Aussie trade setup and more.
Australian Dollar Price Chart – AUD/USD Weekly
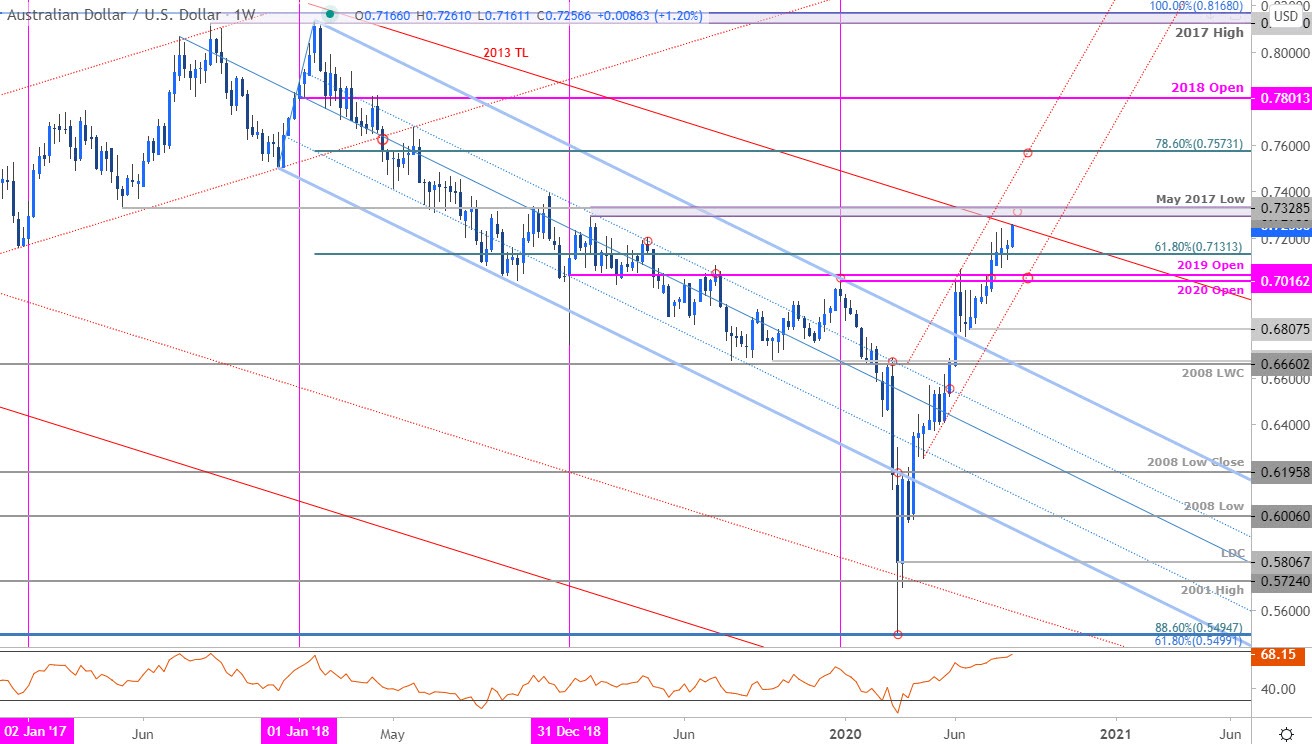
Chart Prepared by Michael Boutros, Technical Strategist; AUD/USD on Tradingview
Notes: In my last Australian Dollar Weekly Price Outlook we noted that the Aussie rally was testing, “key Fibonacci resistance – a close above 7131 is needed to keep the long-bias viable towards7329. A close higher two-weeks later kept the long-bias in play with the advance now testing trendline resistance extending off the late-2013 / 2014 highs.
Critical resistance stands just higher at the 2018 / May 2017 low at 7295-7329 – a breach / close above this threshold would suggest that a major trend reversal is underway with such a scenario exposing the 78.6% retracement at 7573. Look for initial support back at 7131 with broader bullish invalidation now raised to the 2020 / 2019 yearly opens at 7016/42.

Bottom line: The Australian Dollar breakout is testing multi-year trend resistance here and the focus is on the weekly close with respect to this slope. From at trading standpoint, a good zone to reduce long-exposure / raise protective stops – be on the lookout for possible topside exhaustion into this region. Ultimately a larger correction may offer more favorable opportunities with a breach above 7329 needed to mark resumption of the late-March uptrend. Review my latest Australian Dollar Price Outlook for a closer look at the near-term AUD/USD technical trade levels.
For a complete breakdown of Michael’s trading strategy, review his Foundations of Technical Analysis series on Building a Trading Strategy
Australian Dollar Trader Sentiment – AUD/USD Price Chart

- A summary of IG Client Sentiment shows traders are net-short AUD/USD - the ratio stands at -1.46 (40.70% of traders are long) – weak bullish reading
- Long positions are 1.59% higher than yesterday and 1.91% higher from last week
- Short positions are3.25% higher than yesterday and 2.24% lower from last week
- We typically take a contrarian view to crowd sentiment, and the fact traders are net-short suggests AUD/USD prices may continue to rise. Traders are more net-short than yesterday but less net-short from last week and the combination of current positioning and recent changes gives us a further mixed AUD/USD trading bias from a sentiment standpoint.
| Change in | Longs | Shorts | OI |
| Daily | 2% | 3% | 2% |
| Weekly | 29% | -46% | 0% |
---
Key Australia / US Data Releases

Economic Calendar - latest economic developments and upcoming event risk.
Previous Weekly Technical Charts
- British Pound (GBP/USD)
- US Dollar (DXY)
- Canadian Dollar (USD/CAD)
- Japanese Yen (USD/JPY)
- Euro (EUR/USD)
- Gold (XAU/USD)
--- Written by Michael Boutros, Technical Currency Strategist with DailyFX
Follow Michael on Twitter @MBForex


