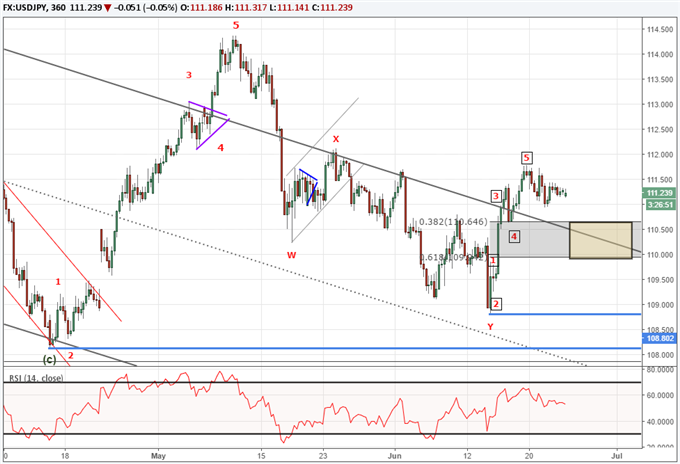
USD/JPY has been advancing in impulsive fashion while correcting lower in three waves. This behavior is typical of a market in an uptrend.
The 2012 low to 2015 high was a five wave impulse, followed by a correction and partial retracement to the August 2016 low.
The August 2016 low to the December 2016 high was a five wave impulse, followed by a three wave correction and partial retracement into the April 2017 low.
The April 2017 low to the May 2017 high is a five wave impulse, followed by a three wave correction and partial retracement into the June 14 low (pictured below).
Since then, USD/JPY has rallied in five waves again. Therefore, we will be looking for a three wave correction that is a partial retracement of the five wave rally.
The key level to watch to the downside is the June 14 low near 108.80. This is the point where a new five wave impulse begins. Therefore, we are anticipating a correction of the current impulse to be a partial correction and hold above 108.80.

Typical stopping points for a correction lower include the range bound between 38.2% and 61.8% of the previous uptrend. That places a potential pivot zone between 109.93 and 110.65.
If correct, the next leg higher may run 300-500 pips. You see, the June 14 advance was nearly 300 pips. Since we have a new trend starting with a five wave sequence, we will look for another advance of similar or Fibonacci proportions. That means the next leg higher could be between 300 and 500 pips long.
IG Client Sentiment shows traders have been shifting net long over the past 24 hours pushing the sentiment reading to +1.84. A shift towards net longs on increasing price is a bearish undertone. Therefore, sentiment lines up with the Elliott Wave model suggesting we may see a dip of prices coming soon. As mentioned above, we are anticipating this dip to be a partial retracement of the June 14 up trend. Learn how to trade with sentiment with our IG client sentiment guide.
Do you find USD/JPY movements confusing? Read our Japanese Yen quarterly forecast.
---Written by Jeremy Wagner, CEWA-M
Discuss this market with Jeremy in Monday’s US Opening Bell webinar.
Follow on twitter @JWagnerFXTrader .
Join Jeremy’s distribution list.
EUR/USD has stalled. Where might we be in the Elliott Wave cycle? Read more on my EURUSD analyst pick.
Read the recent Dow Jones Elliott Wave article.


