


EUR/USD has been grinding sideways for the past month. This appears to be a sideways consolidation prior to another trend higher. From an Elliott Wave perspective, the wave count appears incomplete to the upside.
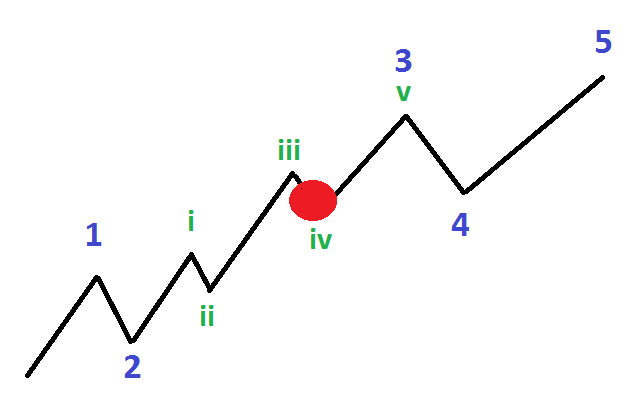
In the idealized picture above, it appears we are in wave (iv) of 3. If correct, we can anticipate possible stopping points for wave (iv) and trade in the direction of the larger trend, which is higher.
Interested in learning more about Elliott Wave Theory? Download the beginner and advanced guides.
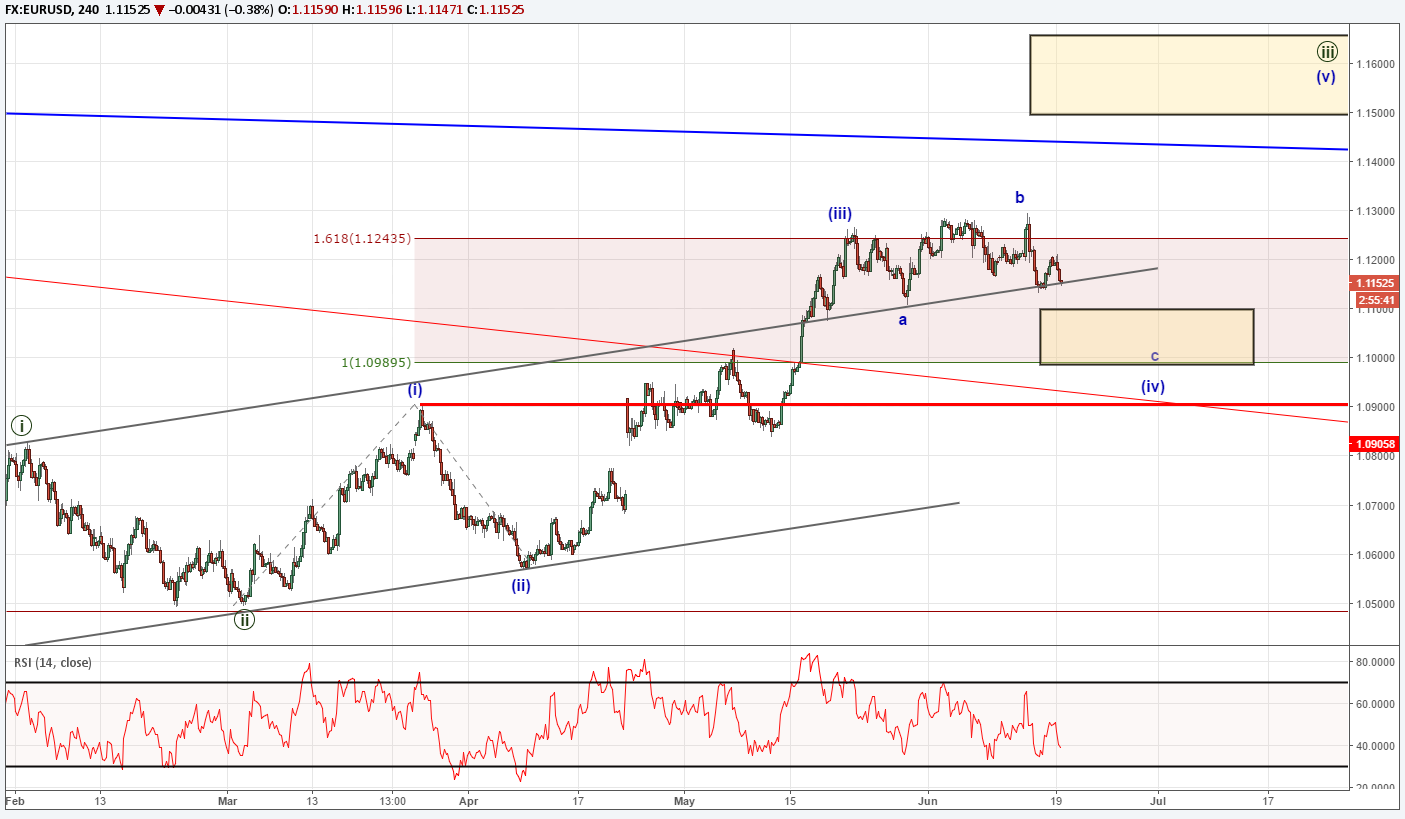
On the live chart above, we see how a ‘c’ wave is needed to complete a flat pattern. Wave relationships put the potential stopping point for wave ‘c’ and wave (iv) near 1.10-1.11. Therefore, we will look to buy a dip into this price zone.
If price continues to drop below 1.0906, then the wave picture as established above is incorrect and we will need reassess the patterns.
As a result, a trader can use 1.0906 as a stop loss for any bullish trades.
We will target new highs above 1.13 and EURUSD may eventually see 1.16-1.17 on a successful breakout higher.
Sentiment is lining up nicely with the Elliott Wave picture. As we speak, live trader positioning is set at -2.3, which means 70% of traders are net short. We use this as a contrarian signal and want to look for areas to establish a long position. Learn more about trading with sentiment by downloading the IG client sentiment guide.
---Written by Jeremy Wagner, CEWA-M
Other recent articles by Jeremy:
USD/CAD Appears to Resume a Longer Term Downtrend
Follow on twitter @JWagnerFXTrader .
Join Jeremy’s distribution list.


