


EUR/USD has been in a monster move to the upside closing higher in six of the last seven trading days. In fact, the daily RSI (Relative Strength Index) has surpassed the highest level since August 2015. Many traders look to RSI as a measure of overbought. Few look to RSI as a means to determine trend, which for EUR/USD, is firmly pointed to the upside.
According to the Elliott Wave model, it appears the trend is incomplete to the upside and further highs may be on the horizon. The break above the red trend line near 1.10 allowed us to elevate our alternate wave count that favors a retest of the 1.16 highs. This would effectively create a large flat or complex correction that began in March 2015.
(Grab out Beginner and Advanced Elliott Wave guide for more on what idealized flat and complex corrections may look like.)
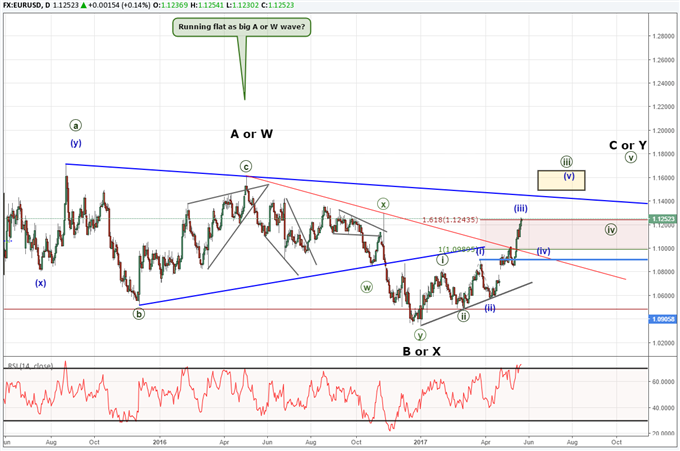
The Elliott Wave model suggests this move to the upside is incomplete because we are looking for five waves to unfold higher beginning in January 2017. It appears the strong moves witnessed last week may have been the middle of circle wave iii. That implies a dip in wave iv and more pressure towards the 1.16 highs. Currently, there is a wave relationship near 1.1244. If this relationship holds, we may see a dip towards 1.10 that offers longs an opportunity to position towards higher levels.
Bottom line, a correction to 1.10 is not required within the wave model, but would be a normal correction in an uptrend of this nature. The wave model suggests a couple more bursts higher may be seen prior to a longer term top forming.
Sentiment has consistently shifted towards the net bears, which ends up being a bullish signal. IG Client Sentiment currently sits at -2.88. We will see symptoms of a turn coming if the sentiment reading shifts towards bulls and begins to move towards the positive side of the coin. Check out the live trader sentiment reading and learn how to trade with sentiment with our IG client sentiment guide.
---Written by Jeremy Wagner, CEWA-M
Discuss this market with Jeremy in Monday’s US Opening Bell webinar.
Follow on twitter @JWagnerFXTrader .
Join Jeremy’s distribution list.
Above, we previously discussed how a break of the red trend line hinted towards a test of 1.16. View the webinar recording at the 21:25 mark to hear the context of those comments.
Will AUD/USD be a late bloomer to the USD correction? Read more to find out.
Dow Jones Industrial Average appears to be grinding in a sideways triangle. See more on critical levels to follow.


