


Dow Jones Industrial Average (DJIA) sold off hard today. Some are blaming US President Donald Trump. Regardless of the reasons, let’s analyze the price pattern using the Elliott Wave model.
The higher probability model suggests the April low of 20,371 likely holds and becomes a key level for the immediate bullish view.
The current bullish view (noted below) is that prices are grinding sideways in a triangle. The pattern since March 2017 has been a series of three wave legs. Under this model, we are nearing the halfway point in the triangle as prices correct lower in a ‘c’ leg. If this pattern holds, we anticipate a potential reversal taking place near 20,575 and possibly as low as 20,371. However, prices would need to hold above 20,371 for the triangle as labeled below to be correct.
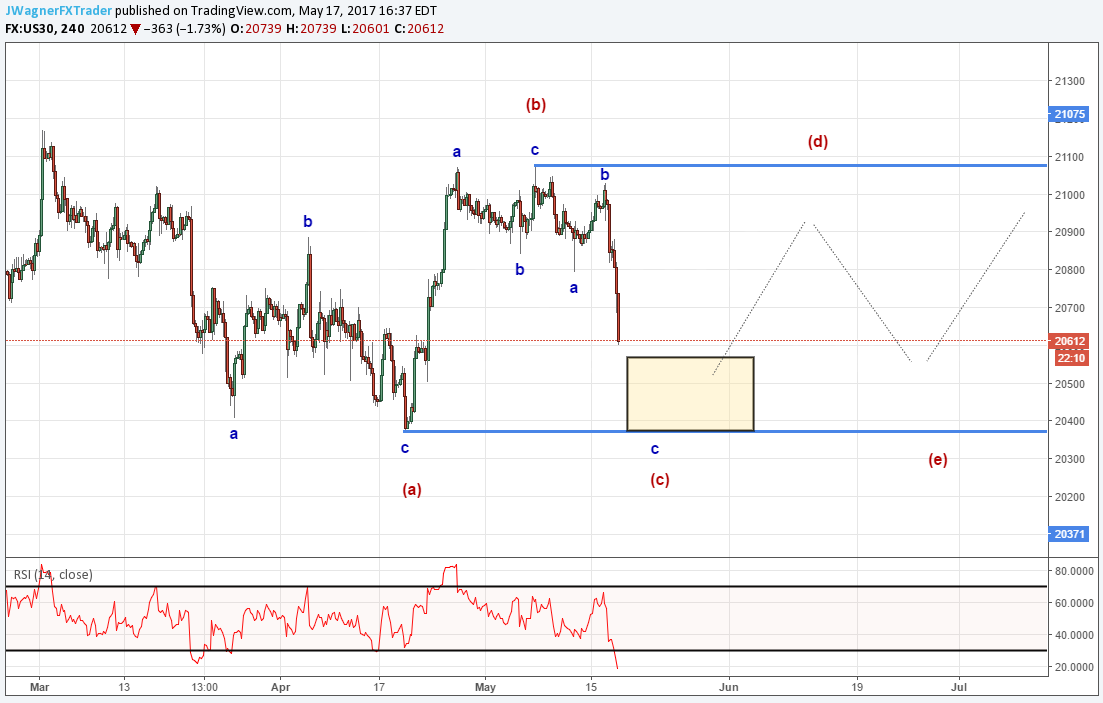
Since DJIA has been printing three wave moves since March, another possibility is a mild break of 20,371 in the ‘c’ wave of a flat correction. Therefore, bulls can use 20,371 as a key level and if it does break, head to the sidelines and await further clarification on the pattern to see if it becomes an Elliott Wave flat.
For more on triangles and flats, grab the advanced Elliott Wave guide and read page 4 and 5.
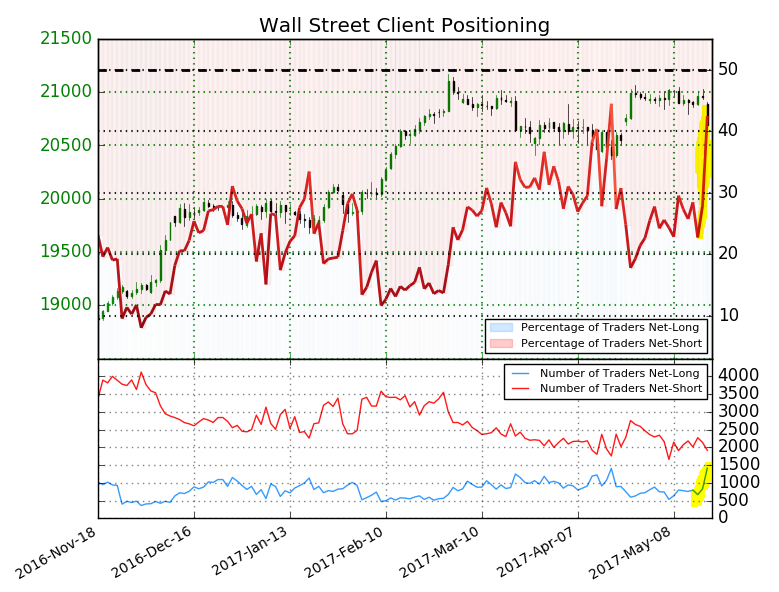
IG Client Sentiment has shifted strongly towards net bulls today. Essentially, traders were buying the dip, which did not work today. The number of traders net long today were 63% higher than yesterday and 48% higher than last week. Learn how to trade with sentiment with our IG client sentiment guide.
---Written by Jeremy Wagner, CEWA-M
Discuss this market with Jeremy in Monday’s US Opening Bell webinar.
Follow on twitter @JWagnerFXTrader .
Join Jeremy’s distribution list.
Read the recent Gold Elliott Wave article calling for $1260.


