


In our previous article, we introduced the topic of the 12 month upward correction being over near the 1.38 high. So far, that high has held while USD/CAD is selling off in apparent impulsive fashion reaching our initial target of 1.3411.
The Elliott Wave model suggests the downtrend is incomplete with more room to sell off. It appears from the model that USD/CAD may be in wave iii of (iii). Wave 3 tends to be the longest and strongest wave. There are some wave relationships showing up near 1.3350-1.3375 that may offer a temporary bump higher.
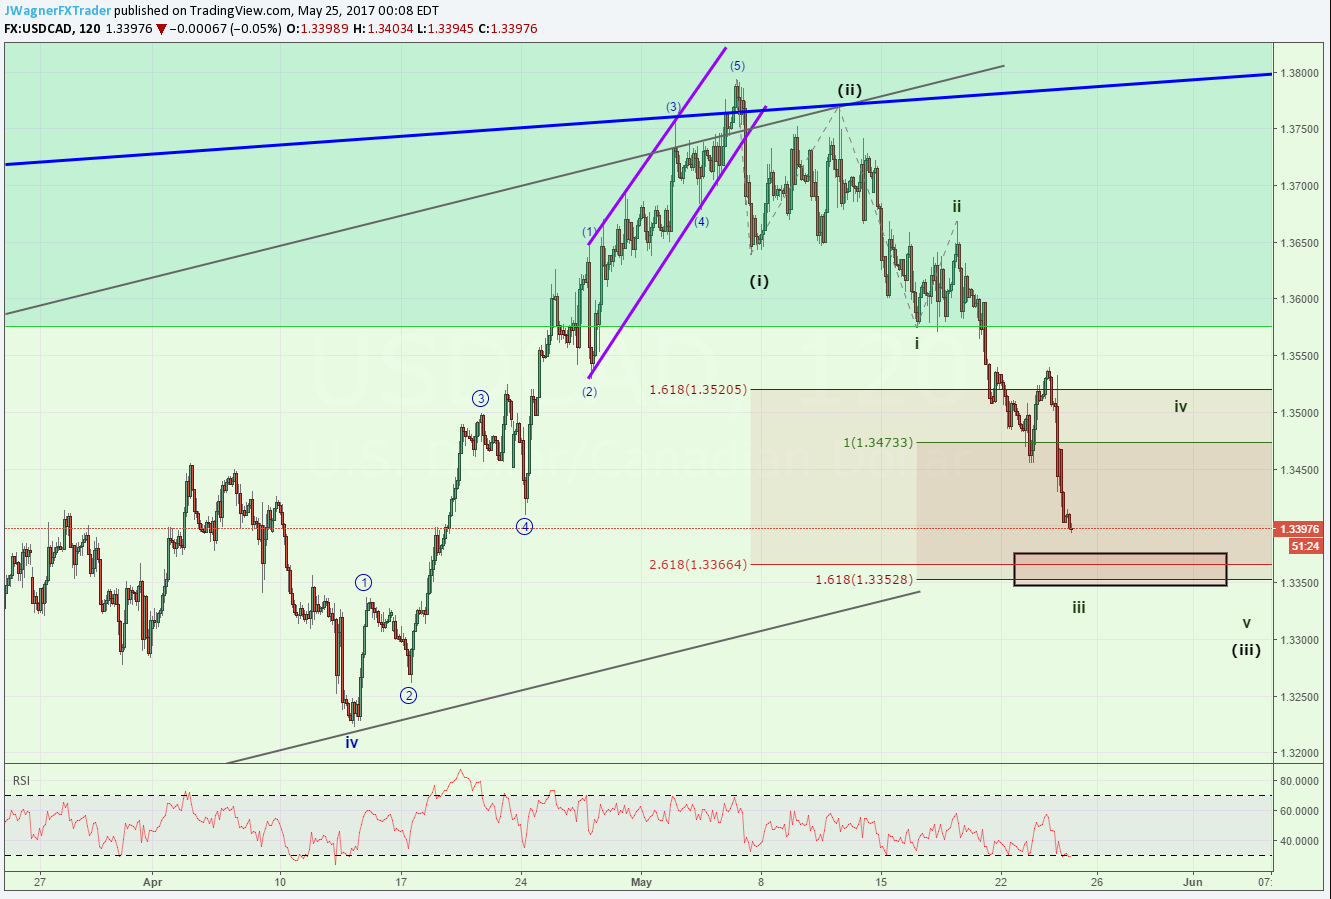
If a bump higher were to develop, it may move USD/CAD up towards 1.3475 – 1.3520. Shorts are offered an opportunity at higher levels near 1.35 on an upward bounce.
If price moves above 1.3575, then it would be cause to pause and review the wave count. We do not anticipate that far of a bounce but it does show up as a lower probability move. Traders could use 1.3575 as a key level for bears.
The larger downside target is near 1.24 on a successful sell off.
Interested in learning more about Elliott Wave Theory? Grab the beginner and advanced Elliott Wave guides.
---Written by Jeremy Wagner, CEWA-M
Discuss this market with Jeremy in Monday’s US Opening Bell webinar.
Follow on twitter @JWagnerFXTrader .
Join Jeremy’s distribution list.
The Elliott Wave model for crude oil prices points sideways to higher levels.
USDJPY’s Elliott Wave model shows it is vulnerable to a 110.60 retest.
EUR/USD has been ripping lately. Read more on the EURUSD Elliott Wave picture.
Read the recent Dow Jones Elliott Wave article.


