


The crude oil price bounce on May 5 at $43.79 fell in line with our quarterly forecast.
“The favored patterns we are watching suggest continued dripping in price towards $39-$43. This price range is where the favored patterns begin to diverge with some patterns pointing towards the upper range of $57 and other patterns pointing towards lower levels that may even retest the February 2016 low of $26.”
Page 4 of DailyFX Q2 Oil Forecast written in March 2017
Now that crude oil prices have bounced from $43.79, the Elliott Wave model suggests sideways to higher trade in the coming weeks. The two favored patterns we are following right now is a big triangle or diagonal pattern.
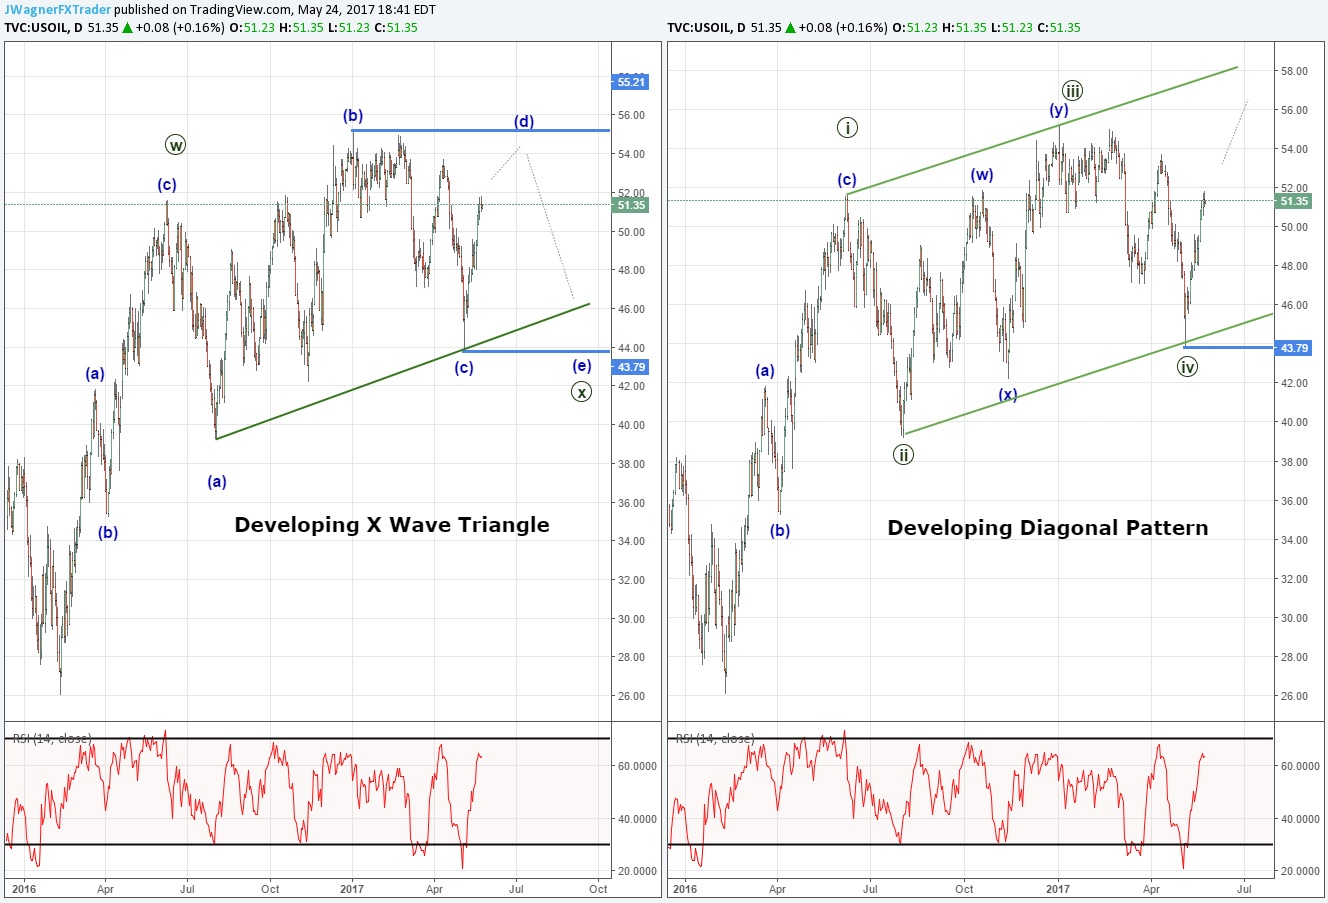
On the split screen above the model on the left illustrates the Elliott Wave triangle and the model on the right illustrates the Elliott Wave diagonal pattern. The wave sequence that creates these two options as the higher probability options is the February to June 2016 up trend. This is clearly a three wave move labeled as (a) – (b) – (c). The subsequent shallow retracement holds the door open for higher prices.
X Wave Triangle
Under this triangle scenario, prices would need to top soon and below $55.21. If a short term pivot forms, we would anticipate one last dip to hold above $43.79 to finish off the triangle pattern. This is an overall bullish pattern that would lead to a break higher. This triangle is valid in the near term so long as crude oil prices are contained between $43.79 and $55.21.
Diagonal Pattern
Under this scenario, the dip to $43.79 was wave four of the five wave diagonal. This sequence implies crude oil prices have begun their ending wave higher. This final wave likely grabs a new high above $57 while holding the green support trend line.
One thing I love about diagonal patterns is that when you identify then near the beginning of wave 5, you can anticipate the maximum distance wave 5 can travel. In this instance, the diagonal pattern is invalidated if crude oil prices exceed $59.77. Above this level, the proposed wave iii would be smaller than wave i and wave v, which violates an Elliott Wave rule.
Below $43.79, we will need to reassess both of the patterns above.
Interested in learning more about Elliott Wave Theory? Grab the beginner and advanced Elliott Wave guides.
---Written by Jeremy Wagner, CEWA-M
Discuss this market with Jeremy in Monday’s US Opening Bell webinar.
Follow on twitter @JWagnerFXTrader .
Join Jeremy’s distribution list.
USDJPY’s Elliott Wave model shows it is vulnerable to a 110.60 retest.
EUR/USD has been ripping lately. Read more on the EURUSD Elliott Wave picture.
Read the recent Dow Jones Elliott Wave article.


