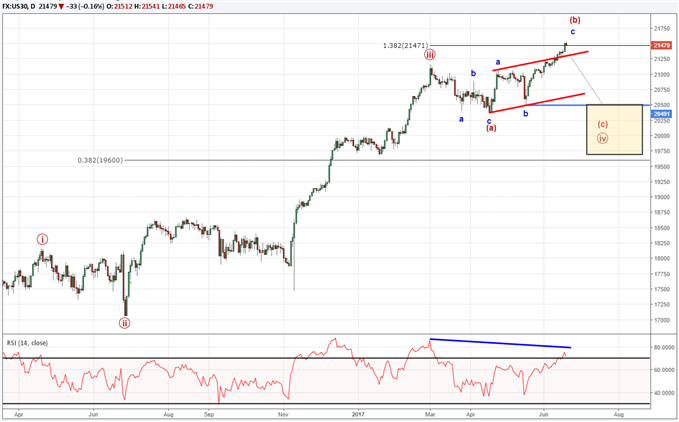
Dow Jones Industrial Average (DJIA) could not follow through on Monday’s gap higher and finished Tuesday on its lows for the day. We have previously identified the 21,471 price zone as an area where DJIA may become uncomfortable and begin to correct. Prices surpassed this level yesterday, but are struggling to hold those recent highs.
One symptom of a looming correction is our Relative Strength Index (RSI). This oscillator located at the bottom of the chart is diverging. That is to say while price is making a higher high, RSI is not surpassing its March 1 high. This is a bearish signal.

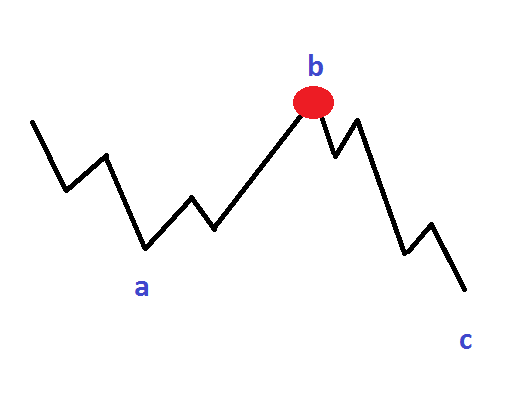
The Elliott Wave model we have been following suggests the trend higher from April 19, 2017 could be a counter trend bounce, the (b) wave in a flat correction (see the idealized image below). That suggests a complete retracement of the April 19 up trend. A warning sign that the correction is underway include filling the gap created from Monday’s open (near 21,384). Additionally, overlapping the April 26 high of 21,072 seals the April 19 to June 19 trend as a three-wave move, which is bearish.
Bottom line, the previous forecast for DJIA still holds such that we are anticipating a correction down towards 20,440 and possibly as low as 19,750.
Interested in learning to trade with Elliott Wave? Get started with the beginner and advanced Elliott Wave guide.

---Written by Jeremy Wagner, CEWA-M
Discuss this market and others with an eye towards Elliott wave in Jeremy’s US Opening Bell webinar on Mondays.
Follow on twitter @JWagnerFXTrader .
Join Jeremy’s distribution list.
Did GBP/USD carve a top for 2017? See how the Elliott Wave model forecasted a drop prior to the June 8 UK election.
USD/CAD Elliott Wave picture implies continued weakness over time. Follow our strings of USDCAD Elliott Wave reports forecasting weakness in the pair.
EUR/USD has been trading sideways. We issued an analyst pick to buy a dip on EUR/USD.


