


New Zealand Dollar, NZD/JPY, NZD/CHF - Talking Points
- The New Zealand Dollar has been strengthening against most currencies
- NZD/JPY has made new highs and appears to have momentum for now
- NZD/CHF has rallied to challenge September highs. Can it break-out?
Introduction to Technical Analysis
Learn Technical Analysis
Recommended by Daniel McCarthy
NZD/JPY TECHNICAL ANALYSIS
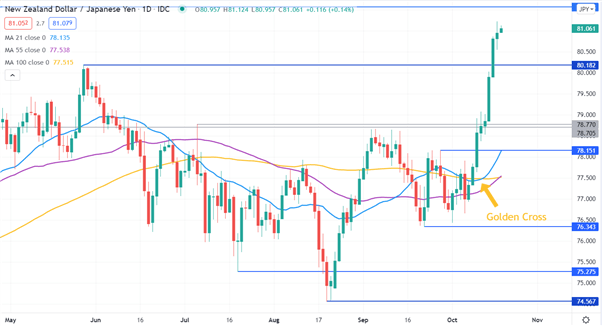
NZD/JPY broke up through multiple resistance levels in the last week to post a 3-year high at 81.224.
In the early stages of the move, the 21-day simple moving average (SMA) crossed above the 100-day SMA to form a Golden Cross which can be a bullish signal.
The Triple Moving Average (TMA) is often seen as a powerful momentum signal when it turns on. There are specific conditions required for the TMA to do so, and so it does not give a signal very often. The NZD/JPY chart below has 3 SMAs. The 21-day, 55-day and 100-day SMAs.
The first condition is order. For a bullish signal, the asset price must be above the short term SMA, which must be above the medium term SMA, which must be above the long term SMA. The second condition is that the gradient of all 3 moving averages must have a positive slope. For a bearish signal, the reverse of all these conditions must be met.
The 55-day SMA appears to be about to cross over the 100-day SMA which would mean meeting the TMA conditions. NZD/JPY has already moved aggressively higher and it remains to be seen if this signal will generate further bullish momentum.
Topside resistance might be offered at the previous highs of 2018 at 81.568, 82.756 and 83.91. On the downside, potential support may be at the pivot points of 80.182 and 78.151.
NZD/CHF TECHNICAL ANALYSIS
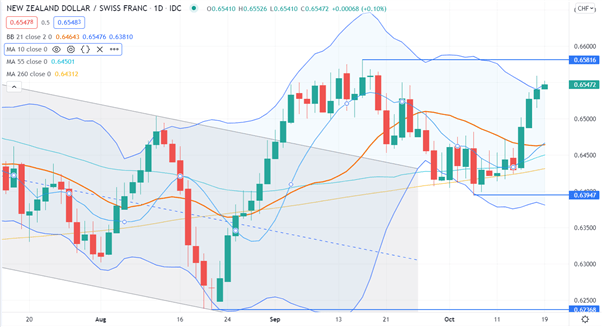
Since breaking through the topside of a descending trend channel early last month, NZD/CHF has traded in a 0.63947 – 0.65816 range. These 2 levels may provide support and resistance respectively.
The NZD strength of late has seen NZD/CHF stretch to touch outside the upper band of the 21-day SMA based Bollinger Band. If there is a close back inside, it might signal that bullish momentum has faded and bearishness could be evolving.
The 10-day, 21-day, 55-day and 260-day SMAs all lie within a tight band below the market between 0.64312 and 0.64665, as shown on the chart below. Additionally, the 100-day and 200-day SMAs also lie near this zone but they are not shown. This could be an important area to watch should it be tested for support.

--- Written by Daniel McCarthy, Strategist for DailyFX.com
To contact Daniel, use the comments section below or @DanMcCathyFX on Twitte


