


Canadian Dollar, USD/CAD, CAD/JPY, EUR/CAD, GBP/CAD – Technical Analysis
- Canadian Dollar has been gaining in recent days, will this continue?
- USD/CAD remains oriented higher, CAD/JPY faces its next key test
- AUD/CAD and EUR/CAD are now facing pivotal points of support
Trade Smarter - Sign up for the DailyFX Newsletter
Receive timely and compelling market commentary from the DailyFX team
USD/CAD Analysis
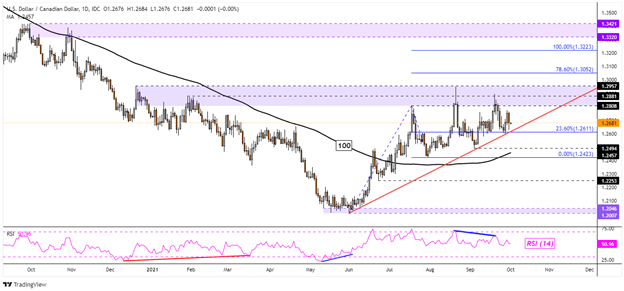
The Canadian Dollar remains cautiously pressured against the US Dollar. While USD/CAD has been rising since June, progress has been slow. This could be due to prices struggling under the wide range of resistance between 1.2808 and 1.2957. This is as negative RSI divergence showed fading upside momentum on multiple occasions.
This is a sign that upside momentum is fading, which can at times precede a turn lower. Still, rising support from June seems to be guiding the pair higher, with the 100-day Simple Moving Average now pointing higher. A breakout under the trendline exposes the September low at 1.2494, before placing the focus on the late July low at 1.2423.
| Change in | Longs | Shorts | OI |
| Daily | -2% | 7% | 5% |
| Weekly | -30% | 38% | 13% |
CAD/JPY Analysis
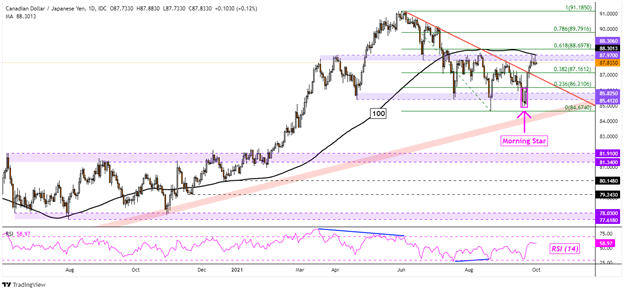
The Canadian Dollar has been extending gains against the Japanese Yen ever since CAD/JPY formed a bullish Morning Star candlestick pattern. Prices also confirmed a break above a falling trendline from May. Still, gains paused right on the familiar 87.97 – 88.30 inflection zone, where the 100-day SMA is also coming into focus.
A breakout above these points may open the door to extending gains, placing the focus on the 61.8% and 78.6% Fibonacci extensions at 88.6978 and 89.7916 respectively. Otherwise, a rejection of the inflection zone could send prices back towards the former falling trendline. It could establish itself as new support. A drop back under it could see the 84.41 – 85.82 support zone come into focus.
AUD/CAD Analysis
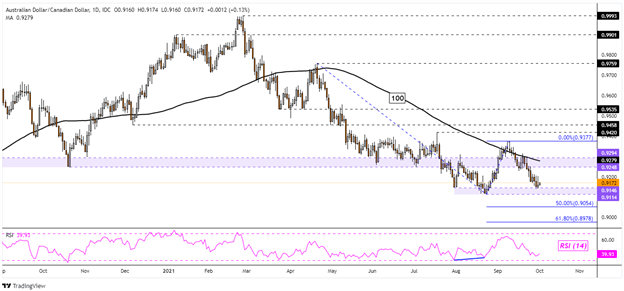
The Canadian Dollar is attempting to resume its advance against the Australian Dollar since late February. However, the 0.9114 – 0.9146 support zone may prevent AUD/CAD from making further downside progress. A bounce from here could see the pair reorient itself higher towards the 0.9248 – 0.9294 inflection zone.
That is where the 100-day SMA may come into play, maintaining the dominant downside focus. If not, a push above these two key points exposes the September high at 0.9377. Breaking above the latter may then open the door to reversing the broader downtrend. Otherwise, clearing key support exposes the midpoint of the Fibonacci extension at 0.9054 towards the 61.8% extension at 0.8978.
EUR/CAD Analysis
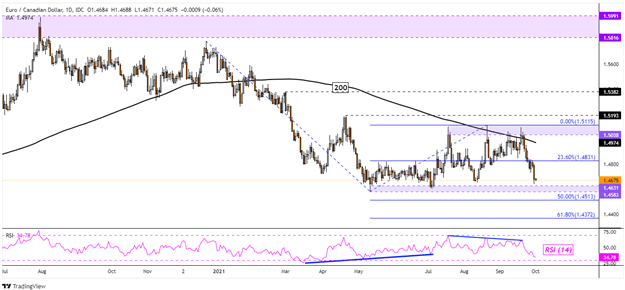
The Canadian Dollar remains in a broadly consolidate state against the Euro since late April. EUR/CAD has been ranging between 1.4583 and 1.5115 over the past few months. The most recent leg has been lower after once again rejecting the 1.5038 – 1.5115 resistance zone. This also followed negative RSI divergence, showing that upside momentum was fading.
Now, the pair is just on the cusp of potentially retesting the 1.4583 – 1.4631 support zone. Clearing this range may open the door to resuming losses since July 2020. That would expose the 50% and 61.8% Fibonacci extensions at 1.4513 and 1.4372 respectively. Otherwise, a bounce off immediate support may open the door back to a pivot towards the ceiling of its wide congestive zone.
--- Written by Daniel Dubrovsky, Strategist for DailyFX.com
To contact Daniel, use the comments section below or @ddubrovskyFX on Twitter


