


British Pound, GBP/AUD, GBP/CAD, GBP/NZD - Talking Points
- GBP/USD volatility took off as sterling plunged and now scopes new lows
- The move lower in GBP/CAD might have momentum but wider range is intact
- GBP/NZD has avoided Sterling weakness of late and consolidated. Will it last?

GBP/USD TECHNICAL ANALYSIS
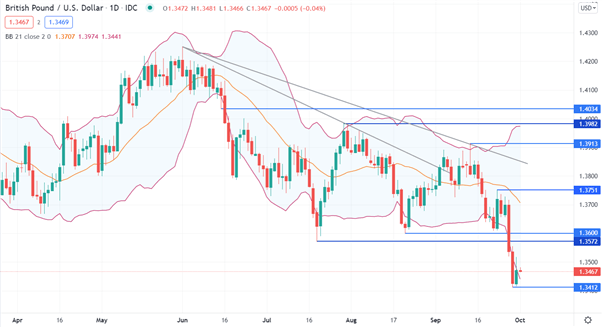
The recent move down in GBP/USD saw 2 previous lows breached at 1.3600 and 1.3572. These 2 levels are pivot points and could offer resistance. Previous highs of 1.3751, 1.3913 and 1.3982 may also offer resistance.
The recent low of 1.3412 moved outside of the 2 standard deviation lower Bollinger Band, based on the 21-day simple moving average (SMA). It has since moved back inside the lower band, which could be bullish.
The low of 1.1410 was in March last year and GBP/USD then rallied to 1.4251 in June this year. Below the market, the 61.8% Fibonacci retracement is 1.3166, a level of potential support. The recent low of 1.3412 is also a possible level of support.
GBP/CAD TECHNICAL ANALYSIS
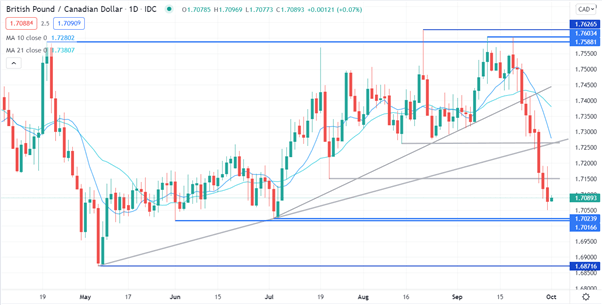
The GBP/CAD has been in broad range since earlier in the year. The recent move down saw GBP/CAD break below previous lows and a couple of ascending trend lines. The previous lows of 1.70239, 1.70166 and 1.68716 might provide support if tested as the cross approaches the lower bounds of the wide range.
The Death Cross of the 10-day SMA moving below the 21-day SMA remains potentially bearish. Topside resistance could be seen at the recent high of 1.71900.

GBP/NZD TECHNICAL ANALYSIS
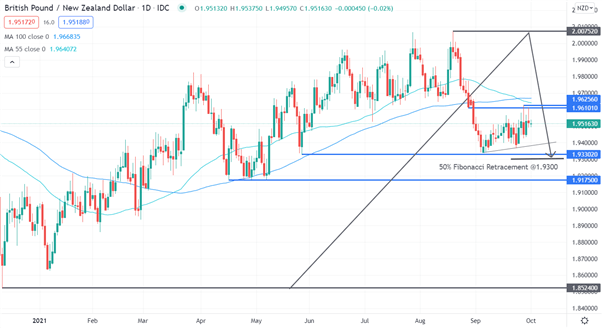
In December, GBP/NZD made a low at 1.8524 and then moved up to a high of 2.0075 last month. The Fibonacci 50% retracement lies at 1.9300, which might provide support. There is a short-term ascending trend line, currently at 1.9385, that could also be a support level. The 2 previous lows of 1.93302 and 1.9175 may also provide support.
The 55-day simple moving average (SMA) crossed below the 100-day SMA. This formed a Death Cross, which could be bearish. The 100-day SMA is currently flat. If the gradient rolls over to be negative, like the 55-day SMA, this may also be bearish.
On the topside, there is a pivot at 1.9610 and a previous high at 1.9625 that are possible resistance levels.
--- Written by Daniel McCarthy, Strategist for DailyFX.com
To contact Daniel, use the comments section below or @DanMcCathyFX on Twitter


