


Death cross: What is it and How to Identify it when Trading?
The ‘death cross’ is a term often mentioned in trading circles due to its usefulness in spotting changes in trends while also being incredibly easy to use. This article will explain the concept of the death cross and how to identify it on price charts. Furthermore, read our article on the Golden Cross to discover complementary indicators to use alongside the simple moving averages when analyzing changing trends.


What is a Death cross?
A death cross occurs when the 50 simple moving average (SMA) crosses below the 200 SMA. The death cross provides a bearish backdrop to the market as short-term price momentum advances lower, with the potential to evolve into a new long-term trend (downtrend).
The 50 SMA is an arithmetic average of closing price levels over the last 50 periods or days, if you are using the daily chart for example. Therefore, the 50 SMA is more reactive to more recent price movement than the 200 SMA, which averages out the last 200 closing prices and tends to create a smoother line, less reactive to recent prices than the 50 SMA.
Learn how to calculate simple moving average in our article, ‘Moving Average Explained for Traders’
How to Identify a Death cross
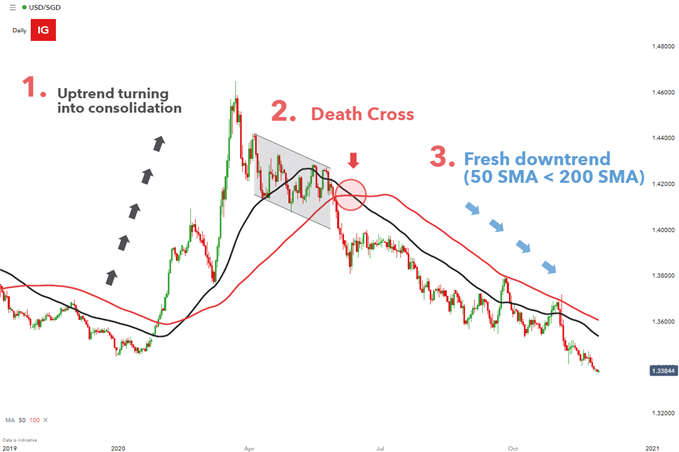
There are three main stages to the formation of the death cross:
1. The lead up: Price action consolidates or, in some scenarios, turns sharply lower after trending higher for a considerable period of time. A period of consolidation provides the initial clue that the uptrend may be starting to lose momentum and could even result in an eventual trend reversal. The 50 SMA remains above the 200 SMA during this stage.
2. The death cross: This is the exact moment the 50 SMA crosses below the 200 SMA, providing the bearish backdrop for the market known as the death cross. The death cross is often interpreted as a trigger to look for entries into the market.
3. Continued downward momentum: Price action advances lower after the death cross is observed, often creating a fresh new trend (downtrend). Ideally, in this stage you may observe the shorter 50 SMA acting as dynamic resistance for price action and price continues to trade below the 50 SMA for some time.

The Simple Moving Average as a Lagging Indicator
By its very nature the simple moving average is a lagging indicator, meaning that it relies on past price action to provide assistance when analyzing current market conditions. Inherently, the SMA has a lag period, resulting in the signal being produced some time after the move has occurred.
Some may view this as a lost opportunity while others may appreciate the delayed signal as it may provide a greater level of conviction that the trend has indeed changed and we aren’t simply witnessing a short term retracement. Shorter-term traders like scalpers and day traders, seeking to capitalize on smaller moves, can make the indicator more responsive by simply reducing the short-term and longer-term moving averages when adjusting the input criteria.