


SWISS FRANC TECHNICAL ANALYSIS, AUD/CHF, CAD/CHF, NZD/CHF – TALKING POINTS
- NZD/CHF’s longer term downtrend remains intact, but short term may see move higher
- AUD/CHF bulls and bears grapple within key levels as prices approach trendline support
- CAD/CHF’s Symmetrical Triangle may soon give way to breakout or breakdown
NZD/CHF Technical Analysis
The Swiss Franc looks poised for further gains against the New Zealand Dollar into the New Year despite recent strength in the Kiwi. NZD/CHF has managed to climb nearly 20% since its 2020 swing low in March when Covid injected a bout of panic across markets. The Swiss Franc remains stronger versus the Kiwi for 2020, however, with the longer-term bear trend in NZD/CHF still strongly intact.
The broader downtrend – rooted in the 2007 multi-decade high – appears poised to continue with the 23.6% Fibonacci retracement from the 2007-2020 move suppressing bullish NZD/CHF price action over the past two months. The 100-Week Simple Moving Average was breached during November’s rally, but the trend indicator remains focused on the downside, along with the 200-week SMA.
NZD/CHF Monthly Chart
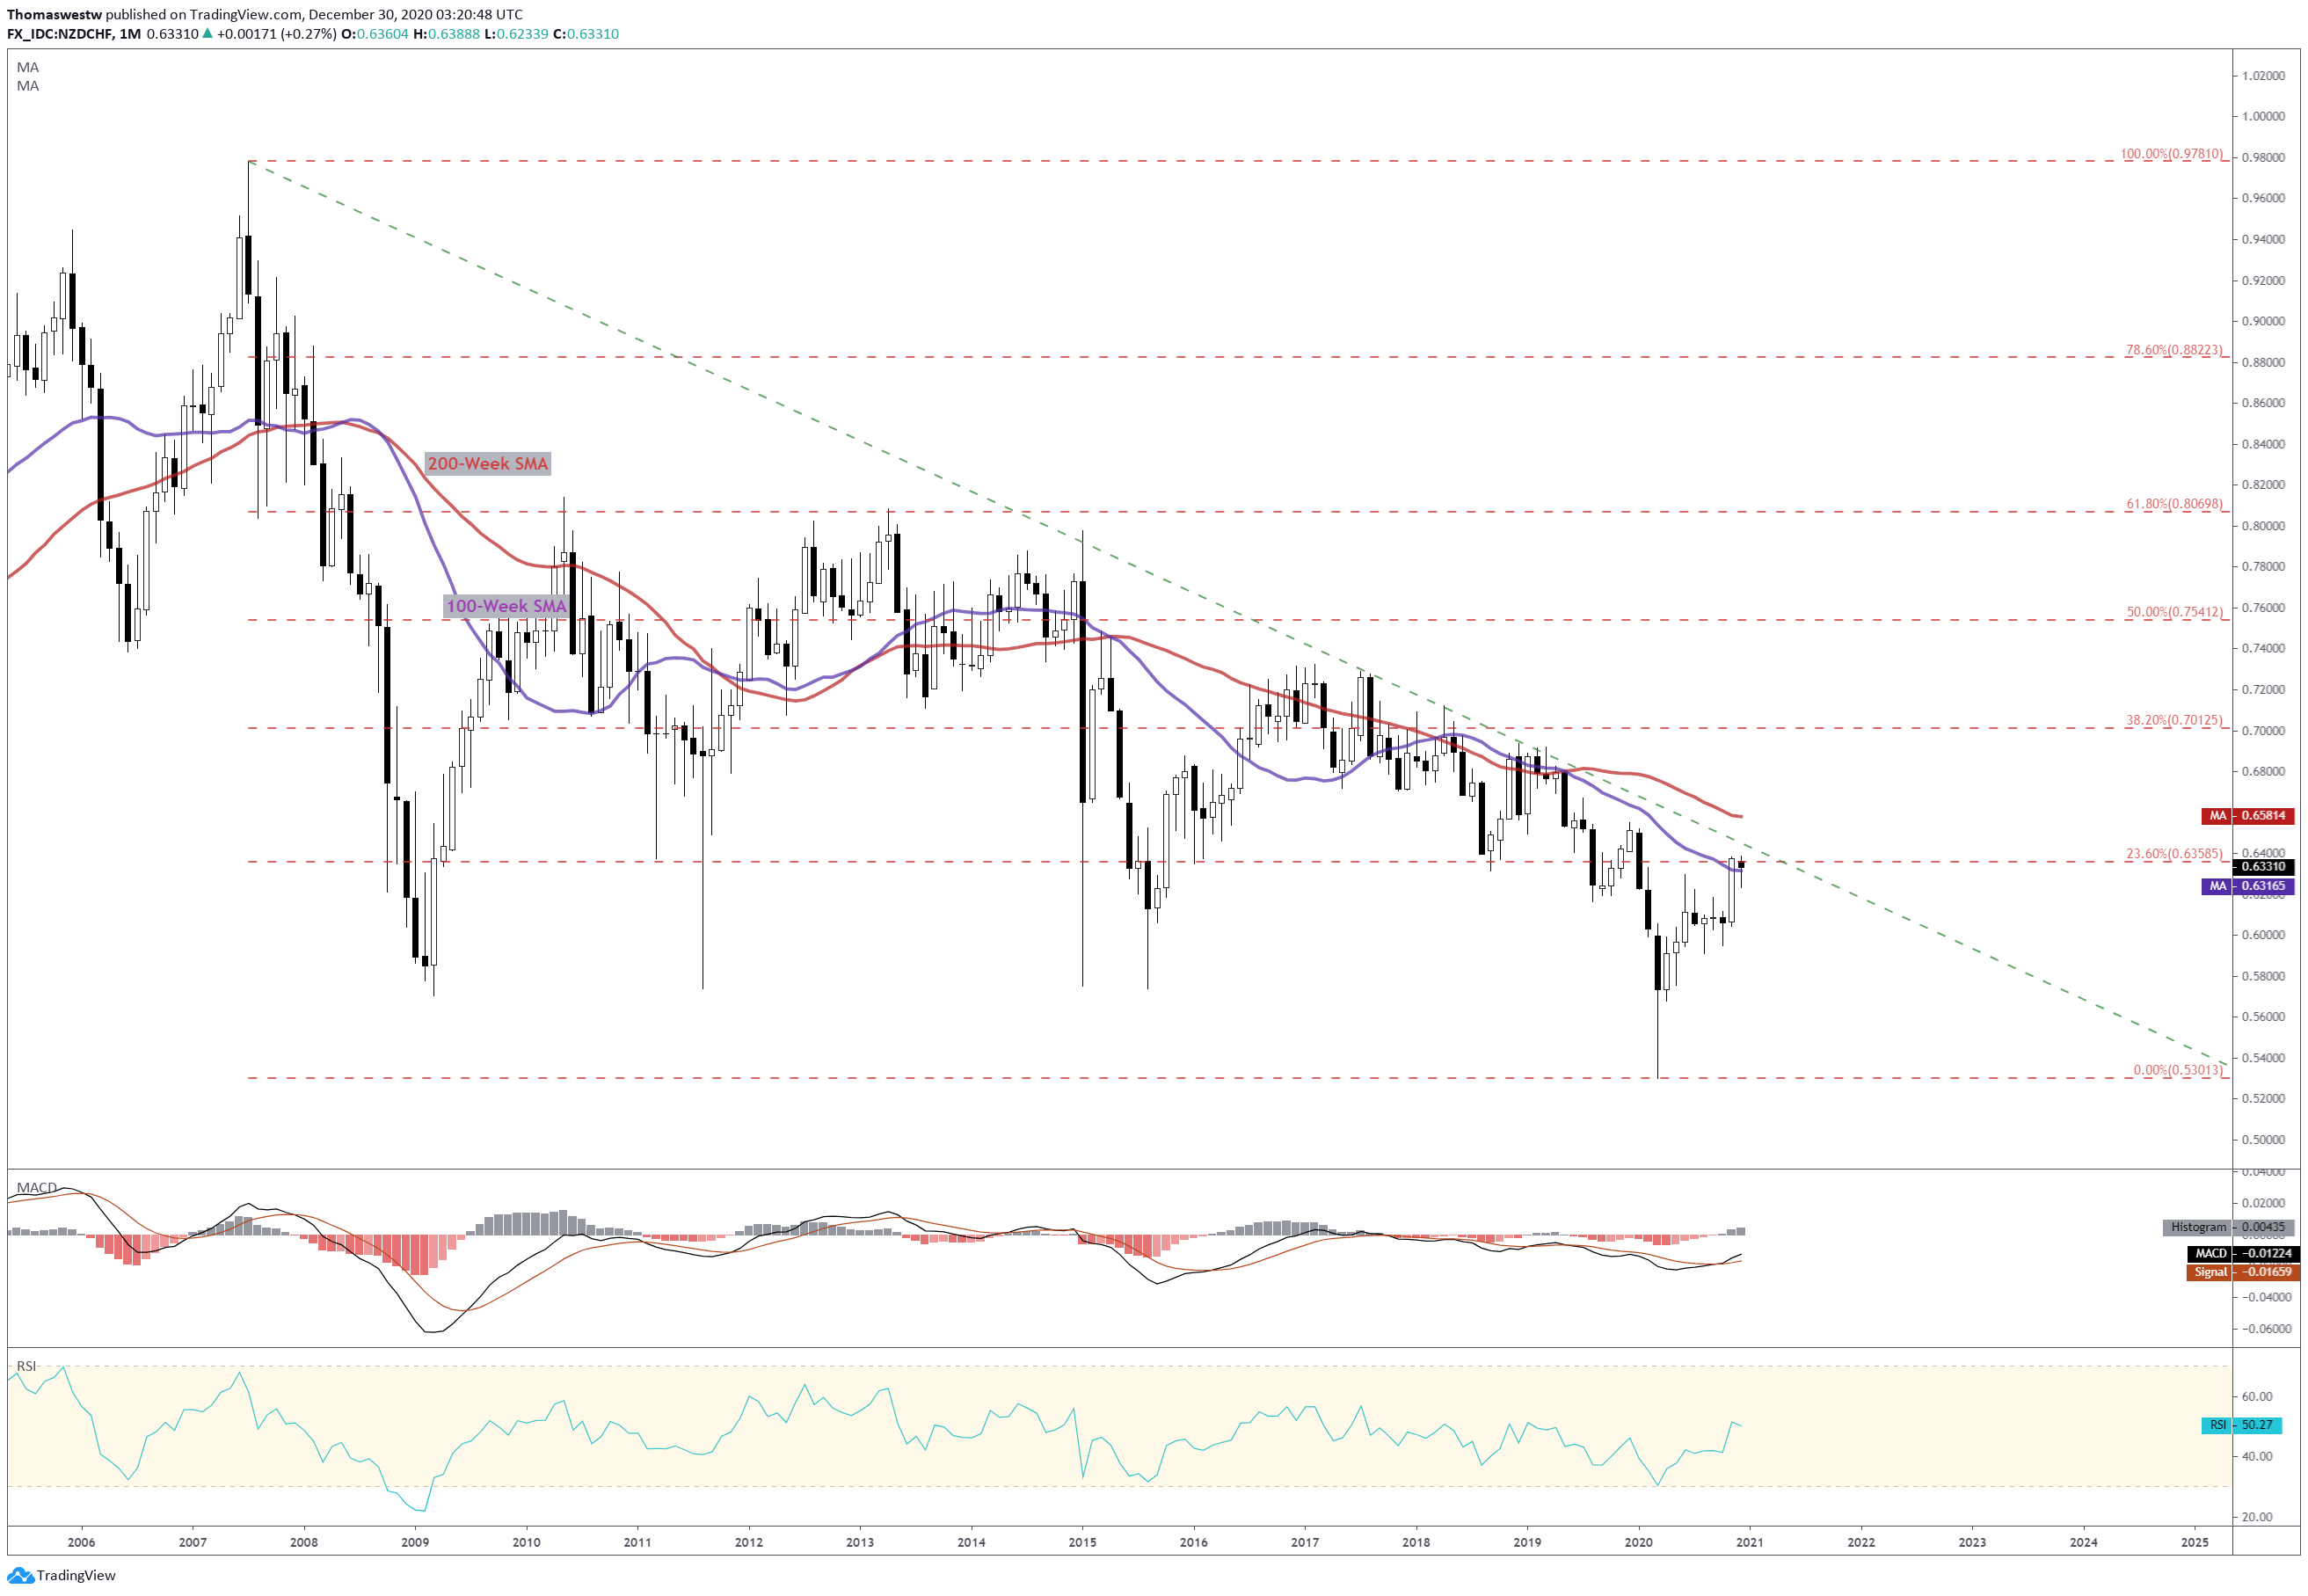
Chart created with TradingView **Moving Averages in Monthly Chart are Weekly SMAs**
Zooming into the daily time frame, NZD/CHF has a more optimistic outlook, at least in the short run. Prices have recently found support near the 78.6% Fibonacci retracement level from the December 2019 – March 2020 move. The recent multi-month high at 0.6388 will likely serve as the next test to the upside. A move lower would see the 9-day SMA come into play.
The MACD also appears to be nearing a bullish cross above its signal line, with the histogram nearly in positive territory. The 100- and 200-day SMAs are also firmly tracking to the upside. The RSI oscillator is also showing a bullish bias. A break above the aforementioned multi-month high would see trendline resistance from the 2007 high, which would signal a major victory for bulls. Nevertheless, if prices do reach that level, expect heavy resistance given the trendline’s history.
NZD/CHF Daily Chart

Chart created with TradingView
AUD/CHF Technical Analysis
The Australian Dollar looks ready to climb higher in the near term against the Swiss Franc. AUD/CHF gave way to bearish action back in September with the cross subsequently breaching below its 50-, 100-, and 200-day SMAs before finding support in an inflection area from earlier in the year. The following move higher saw trendline support from the 2020 low develop as prices climbed to current levels.
Now, with prices approaching support, AUD/CHF is currently grappling with the June 2020 high. The MACD oscillator remains in a bullish stance with the MACD line recently starting to diverge again. A move lower would likely see the aforementioned September high serve as support. However, the path higher appears to be the one of least resistance.
AUD/CHF DAILY CHART

Chart created with TradingView
CAD/CHF TECHNICAL ANALYSIS
The Swiss Franc’s most interesting technical structure appears to be against the Canadian Dollar, with a Symmetrical Triangle looking to give way to a potential breakout in the near term. CAD/CHF prices are currently tracking near the triangle’s support line, giving a modestly bearish stance. However, prices may very well retrace higher to trendline resistance.
A break below the triangle may give way to an extended push lower, where the 61.8% Fibonacci retracement from the March-June move would serve as a final defense for CAD/CHF bulls to contain a breakout. Notwithstanding, the 78.6% Fib retracement appears to be an attractive target. A break higher out of the triangle would likely see the 23.6% Fib retracement move into focus. That said, a breach of the triangle, higher or lower, serves as the most pertinent technical level to watch.
CAD/CHF Daily Chart
Chart created with TradingView
Swiss Franc Trading Resources
- Just getting started? See our beginners’ guide for FX traders
- What is your trading personality? Take our quiz to find out
- Join a free webinar and have your trading questions answered
--- Written by Thomas Westwater, Analyst for DailyFX.com
To contact Thomas, use the comments section below or @FxWestwater on Twitter


