


GBP/USD, GBP/CAD, GBP/NZD, GBP/CHF - Technical Forecast
- British Pound seems mostly in consolidation mode against major peers
- GBP/USD has been ranging since mid-March, GBP/CAD eyes support
- GBP/NZD flirting with downside breakout? GBP/CHF faces trend lines
GBP/USD Technical Analysis
The British Pound remains in consolidation mode against the US Dollar as GBP/USD trades between 1.2163 and 1.2648 on the daily chart below. Prices recently attempted to test support but stopped short of reaching the outer boundary at 1.2228. This has placed the focus towards resistance at 1.2485 on the way to 1.2595. Resuming gains may see prices retest the inflection point between 1.2726 to 1.2769. A material decline may see prices test lows form 2016 and 2017 which could stand in the way as support between 1.1950 – 1.2018.
What are some unique aspects of trading forex?
GBP/USD – Daily Chart

GBP/CAD Technical Outlook
GBP/CAD also remains in a similar situation as GBP/USD with prices consolidating between support (1.7184) and resistance (1.7795). The broader trajectory for this pair seems to favor the upside when taking into consideration rising support from August – pink lines on the daily chart below. A drop through support exposes what could be the next barrier between 1.6920 – 1.6981. Otherwise, a turn higher may see prices attempt to revisit consolidation resistance on the way towards current 2020 peaks.
GBP/CAD - Daily Chart

GBP/NZD Technical Outlook
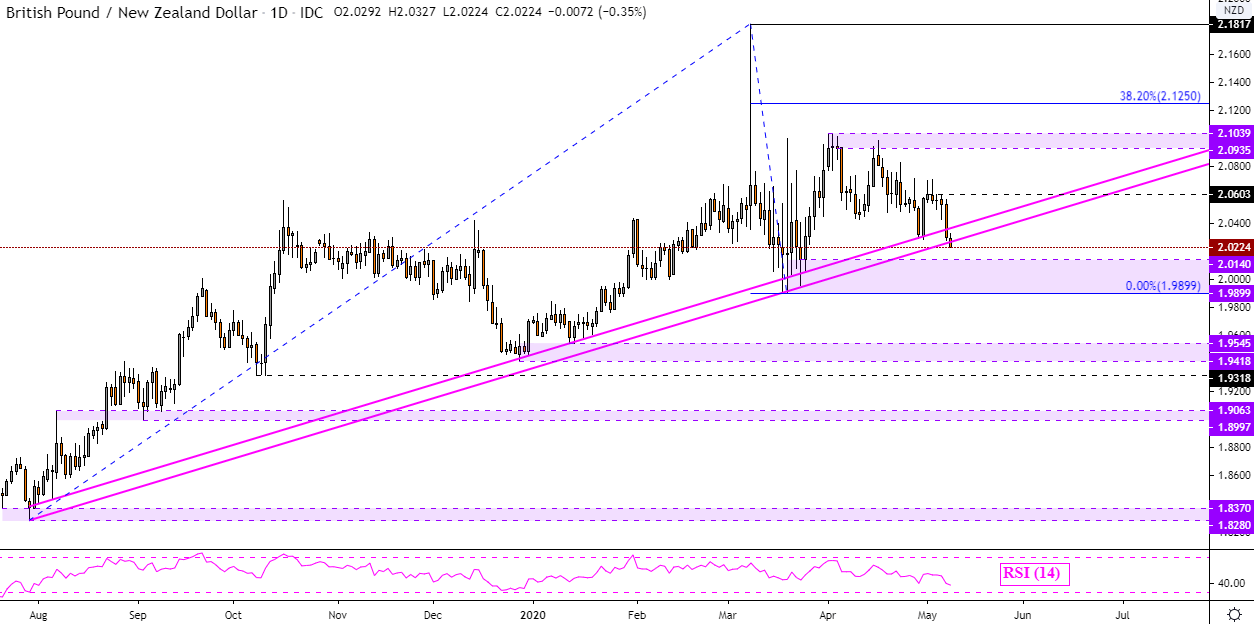
The British Pound may be at risk to the New Zealand Dollar with GBP/NZD attempting to break under rising support from July – pink lines on the daily chart below. With confirmation, this may open the door to a material reversal that would then place the focus on support which is a fairly wide range between 1.9899 – 2.0140. Clearing this technical barrier may pave the way for further weakness. In the event of a push higher instead, that could place the focus on resistance at 2.0603 on the way towards 2.0935.

GBP/NZD – Daily Chart
GBP/CHF Technical Outlook
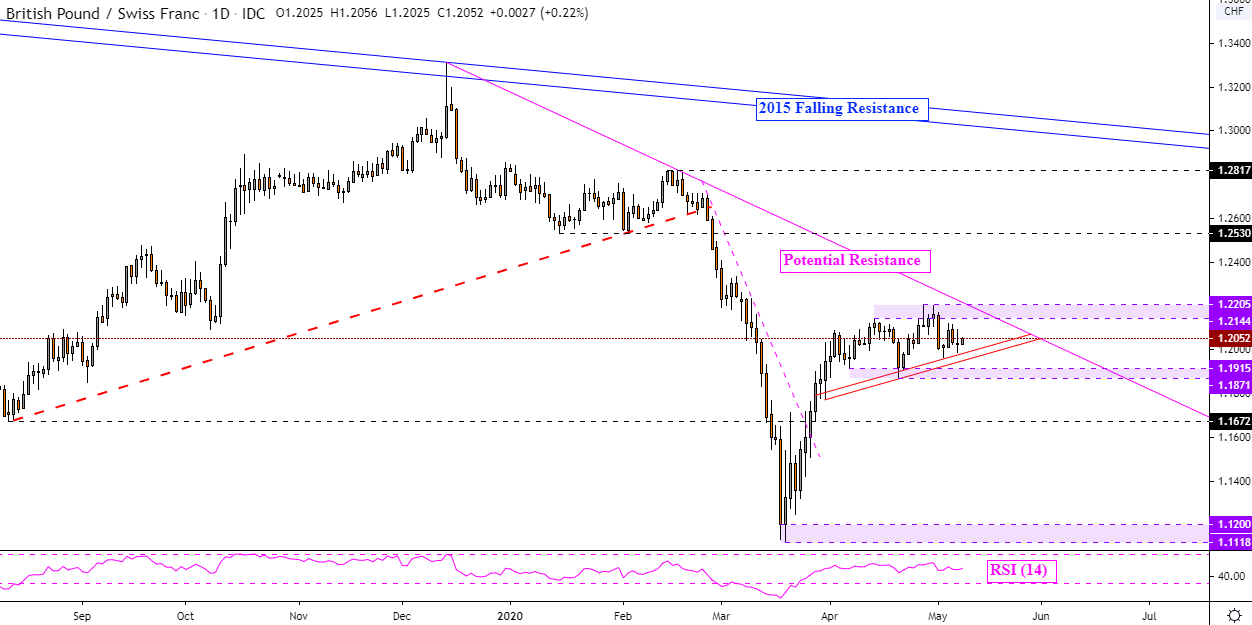
GBP/CHF seems to be in a cautiously upward trajectory as rising support from April guides the pair towards what may be a potential falling trend line from December – pink line on the daily chart below. Broadly speaking, there does seem to be consolidation between 1.1871 to 1.2205. A drop through support would expose the former low from August at 1.1672. Clearing resistance – with confirmation – may open the door to retesting 1.2530.
GBP/CHF - Daily Chart
--- Written by Daniel Dubrovsky, Currency Analyst for DailyFX.com
To contact Daniel, use the comments section below or @ddubrovskyFX on Twitter


