


US Dollar, USD/SGD, USD/MYR, USD/IDR, USD/PHP – ASEAN Technical Analysis
- US Dollar may attempt comeback against ASEAN currencies in near term
- USD/SGD needs further upside confirmation after the bullish candlestick
- USD/MYR faces RSI divergence, key USD/IDR uptrend in play, PHP idles
Singapore Dollar, Malaysian Ringgit, Indonesian Rupiah, Philippine Peso Technical Outlook
The US Dollar may be attempting a recovery against ASEAN currencies such as the Singapore Dollar, Malaysian Ringgit, Indonesian Rupiah and Philippine Peso. On the chart below, my ASEAN-based USD index – which averages it against SGD, MYR, IDR and PHP – closed above near-term falling resistance from February.
With upside confirmation, that may open the door for the Greenback to revisit last month's peaks. Downtrend resumption entails a close through the March 6 low. Do note that the high levels of volatility in equities amid the coronavirus outbreak may exacerbate price swings in the near term. Check out my latest ASEAN fundamental outlook to see what’s in store for the Dollar here.

ASEAN-Based US Dollar Index – Daily Chart
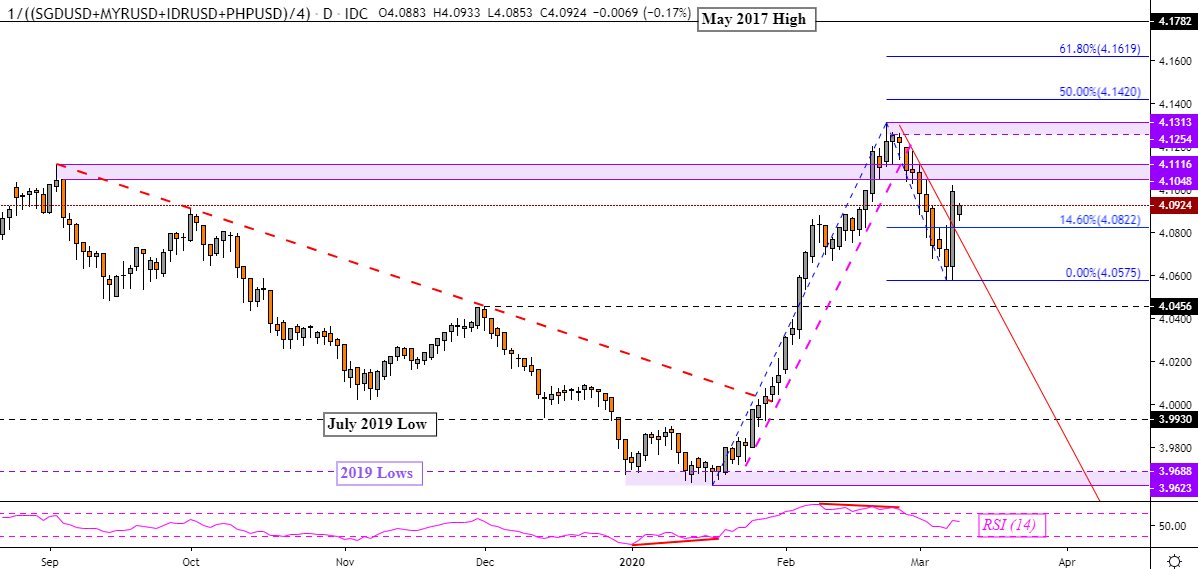
ASEAN Index Chart Created in TradingView
Singapore Dollar Technical Outlook
USD/SGD formed a Bullish Engulfing after Monday’s close, opening the door to weakness in the Singapore Dollar. A daily close through falling resistance from February – red lines below – may pave the way for USD/SGD to revisit last month’s peak. Otherwise, the close through rising support from January maintains the near-term downward technical bias. The latter entails a fall through 1.3760 which exposes the December inflection area barrier between 1.3669 to 1.3692.
Learn more about how the MAS conducts monetary policy and what matters for the Singapore Dollar !
USD/SGD Daily Chart
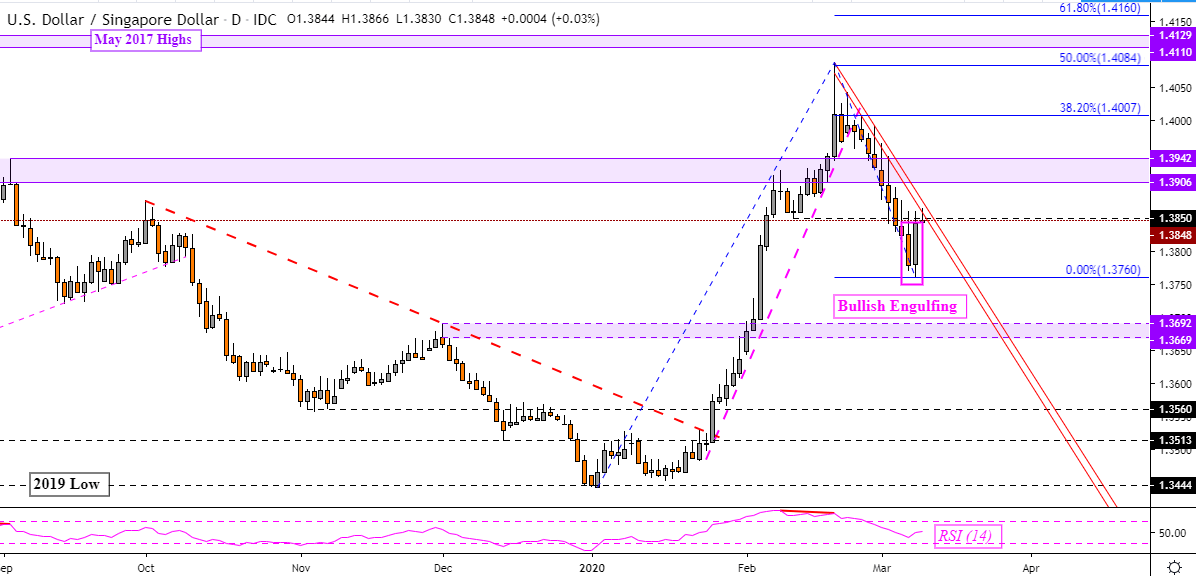
USD/SGD Chart Created in TradingView
Malaysian Ringgit Technical Outlook
The US Dollar may be pushing for uptrend resumption against the Malaysian Ringgit. This followed a bounce on potential rising support from January – pink line below. Closing above February’s peak opens the door to perhaps revisiting the June-August 2017 range top between 4.2985 to 4.3085. Yet, negative RSI divergence shows that upside momentum is fading which may precede a turn lower. That places the focus on immediate resistance at 4.2051 which is the 23.6% Fibonacci extension.

USD/MYR Daily Chart
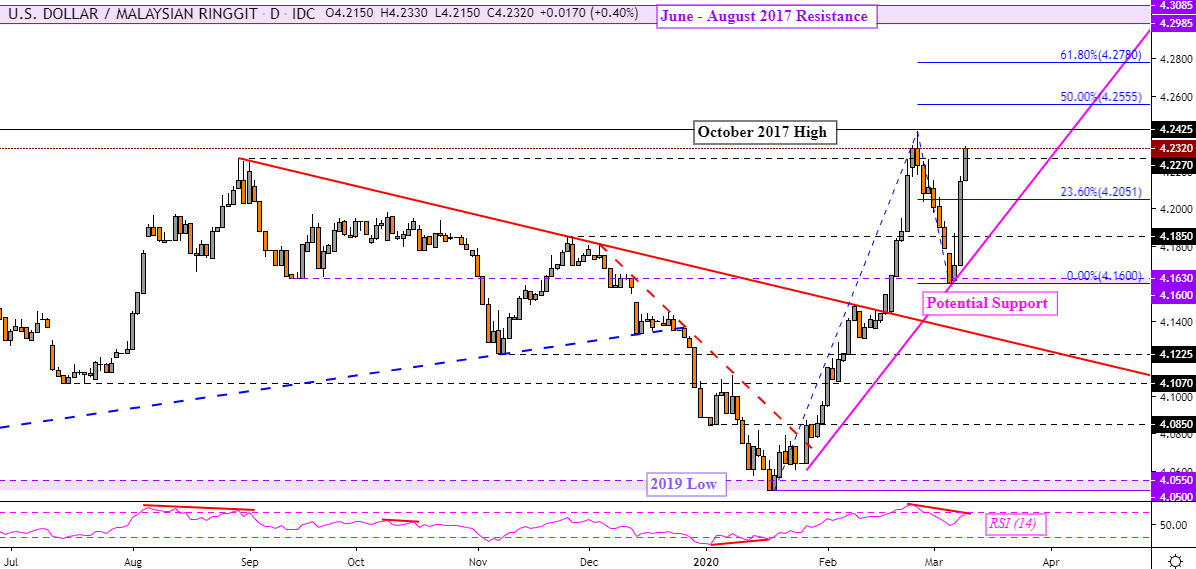
USD/MYR Chart Created in TradingView
Indonesian Rupiah Technical Outlook
The US Dollar has also bounced against the Indonesian Rupiah after USD/IDR revisited resistance-turned-support between 14130 to 14164. Broadly speaking, the close above the falling trend lines from 2019 maintains the upward technical outlook. That may pave the way for a test of highs from May, forming resistance between 14484 to 14525. Otherwise, a turn lower places the focus on what may be a potential rising trend line from February.
USD/IDR Daily Chart
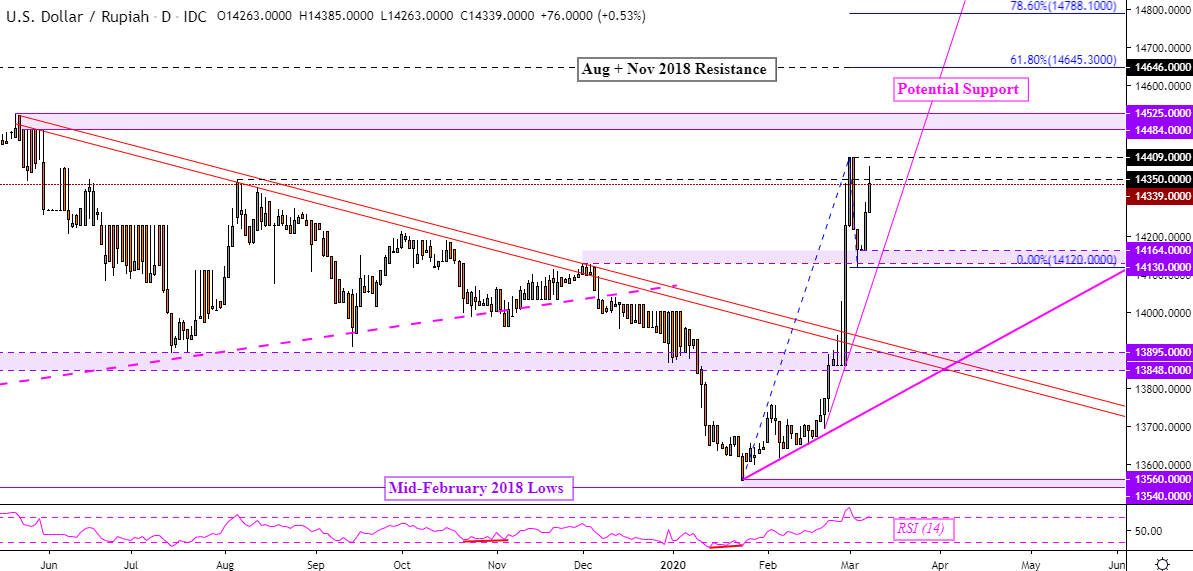
USD/IDR Chart Created in TradingView
Philippine Peso Technical Outlook
The US Dollar remains in a persistent consolidation mode against the Philippine Peso. Prices remain rangebound between 50.40 to 51.30. The push through falling resistance from August – red lines below – failed to find material upside follow-through. Positive RSI divergence is present and that could result in another bounce back to horizontal channel resistance. A daily close through the bottom exposes the 50% midpoint of the Fibonacci extension at 50.10.
To stay updated on fundamental developments for ASEAN currencies, follow me on Twitter here @ddubrovskyFX
USD/PHP Daily Chart

USD/PHP Chart Created in TradingView
--- Written by Daniel Dubrovsky, Currency Analyst for DailyFX.com
To contact Daniel, use the comments section below or @ddubrovskyFX on Twitter


