


US Dollar, Singapore Dollar, Indonesian Rupiah, USD/SGD, USD/IDR – ASEAN Technical Analysis
- US Dollar facing bearish technical signals against ASEAN currencies
- Momentum against the Singapore Dollar is fading, will USD/SGD fall?
- The Indonesian Rupiah weakened but key USD/IDR resistance still held
Singapore Dollar and Indonesian Rupiah Technical Outlook
Coronavirus fears have sent the US Dollar storming higher against ASEAN currencies such as the Singapore Dollar and Indonesian Rupiah. Yet, technical signals seem to be erring on the side of caution at this point. Taking a look at my ASEAN-based US Dollar index – an average of USD versus SGD, MYR, IDR and PHP – negative RSI divergence is greeting the break above September highs. At times, this can precede a turn lower given downside confirmation. What is the road ahead for USD/SGD and USD/IDR?

ASEAN-Based US Dollar Index – Daily Chart

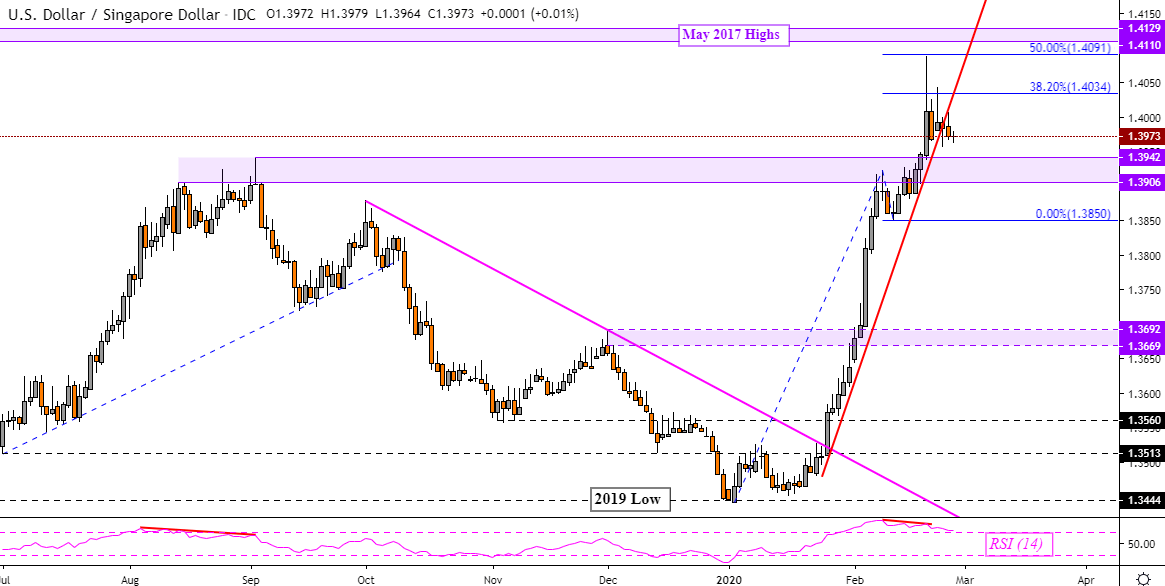
USD/SGD Chart Created in TradingView
Singapore Dollar Technical Outlook
The Singapore Dollar may be at a technical turning point against the US Dollar. USD/SGD appears to be aiming under the rising trend line from late January following the emergence of negative RSI divergence. Near-term declines could pave the way for a push towards the February 12 low at 1.3850. If this point is taken out, that risks reversing the immediate uptrend. In the event of a push higher, keep an eye on the 38.2% Fibonacci extension at 1.4034 should the US Dollar push towards highs from May 2017.
Learn more about how the MAS conducts monetary policy and what matters for the Singapore Dollar !
USD/SGD Daily Chart
USD/SGD Chart Created in TradingView
Indonesian RupiahTechnical Outlook
The US Dollar struggled to push higher against the Indonesian Rupiah after USD/IDR tested key falling resistance from April. Using the weekly chart below, the currency pair is retesting the former horizontal psychological barrier which has its beginnings from June 2018. Generally speaking, the medium-term USD/IDR technical bias shifted bearish after prices closed under rising support from late 2017.
USD/IDR Weekly Chart

USD/IDR Chart Created in TradingView
Zooming in on the daily chart, maintaining the near-term bullish trajectory in USD/IDR is rising support from January. This psychological barrier may come into focus if the Rupiah finds some ground against the Dollar after the latter failed to breach falling resistance. A further bullish shift in the USD/IDR outlook entails closing above descending resistance from May 2019. That would expose highs from November.
USD/IDR Daily Chart

USD/IDR Chart Created in TradingView
--- Written by Daniel Dubrovsky, Currency Analyst for DailyFX.com
To contact Daniel, use the comments section below or @ddubrovskyFX on Twitter


