


USD/MXN Highlights:
- USD/MXN decline out of triangle may turn out to be a false break
- The often-tight inverse correlation to S&P 500 has been especially strong
- Stocks are at an extreme, a drop could soon see USD rise vs MXN
Just last month USD/MXN broke down out of a long-term volatility pattern (triangle starting in 2017), but that may not continue to hold the bearish implications it initially implied, instead it may have been nothing more than a fake-out breakout.
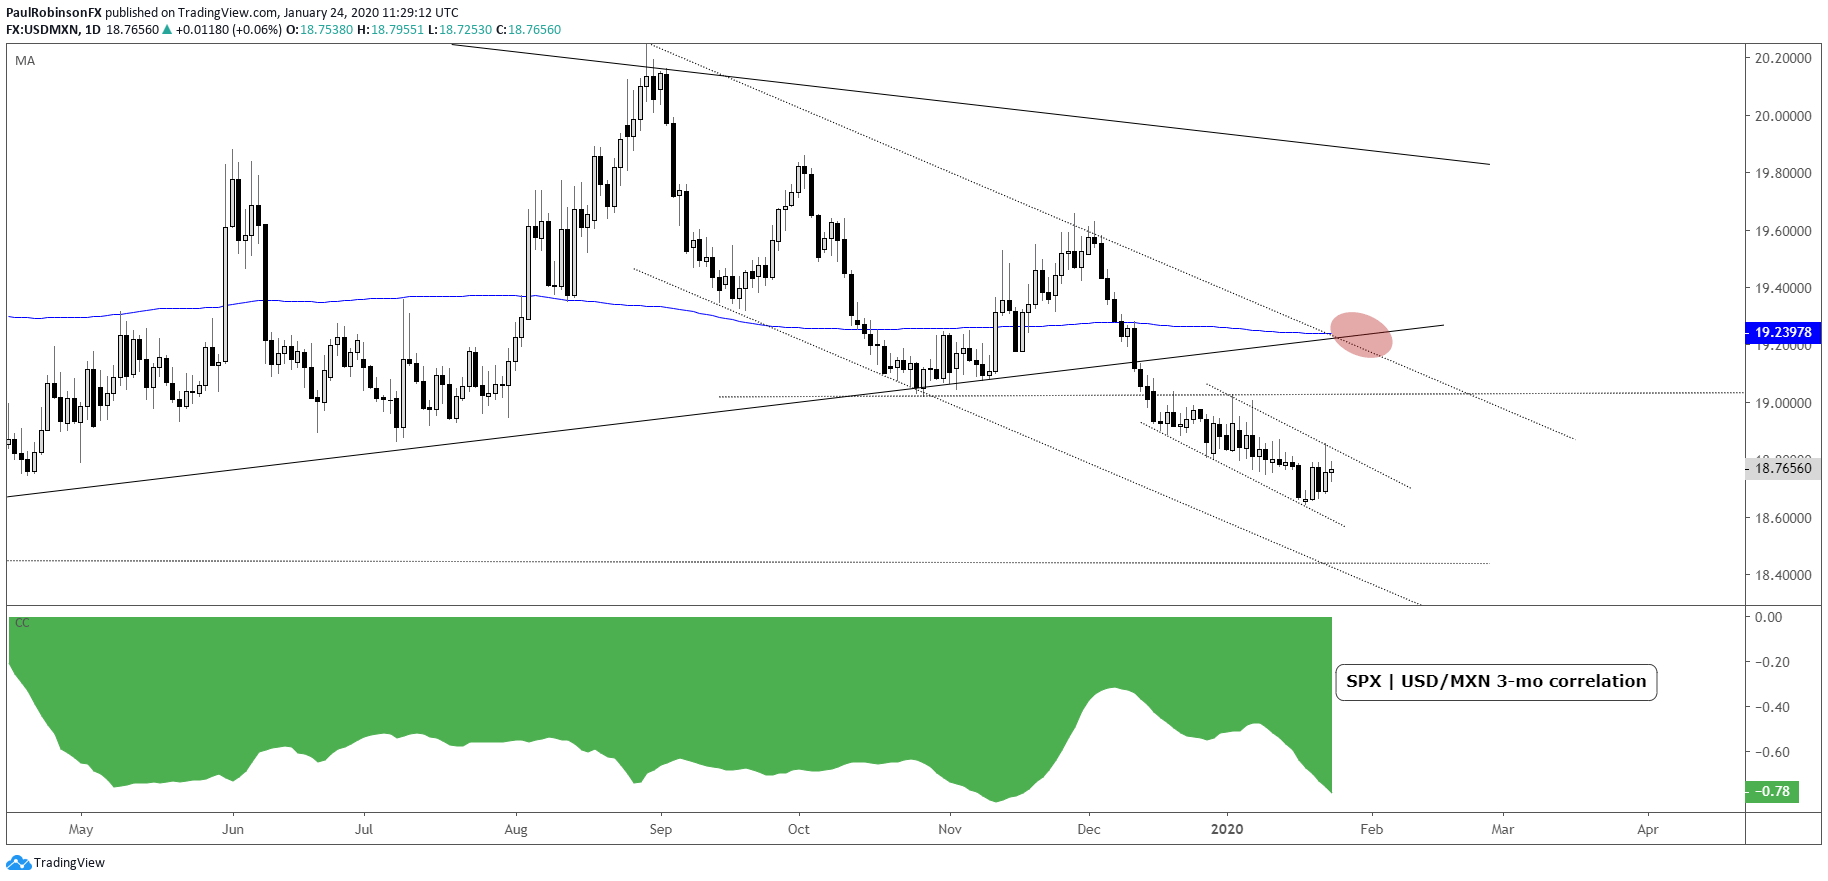
It seemed the breakdown was about to gain traction last week when price slipped below the 2019 low, but the key break hasn’t garnered much attention so far. And with the relationship between USD/MXN and the S&P 500 holding about as steady as any time since 2015/16, a slip in stocks could mean a rip in USD/MXN.
It’s a yield-seeking risk on-off thing here with this relationship – buy stocks, buy Pesos; sell stocks, buy Dollars. The 1-mo correlation (SPX vs USD/MXN) is 0.89, while the 3-mo is at -0.78. Correlations can fall apart quickly, but until it does it suggests that should stocks top and drop we will see a rise in USD vs MXN.
Stocks have been on a tear of late, and the S&P 500 has shown little signs of slowing. There are plenty of extremes out there to point to which suggest at least a correction is near, but so far nothing. When the market gets extremely overbought as it is now, sudden breaks can develop with limited warning, so keep one eye on the S&P in the days/weeks ahead.
Looking at the USD/MXN chart, there is a narrow descending channel in progress, highlighting the low volatility (complacency) we have been seeing in financial markets. A break in stocks, and climb up out of the channel could have the pair rising towards a retest of the bottom of the triangle and 200-day MA near 19.25.
Should the move turn aggressive, a break back inside the triangle and above the upper trend-line of the pattern could become the outcome, which would be a huge development. The long-term triangle broke to the downside, but these patterns are known for making a false break before finding traction in the opposite direction. With the breakout occurring against a strong long-term trend that appears to have an even higher risk of becoming the case in this situation. Exciting days could lie just ahead for USD/MXN.

USD/MXN Weekly Chart (bearish triangle break a fake?)

USD/MXN Daily Chart (correlation to SPX, descending channel)
***Updates will be provided on the above thoughts and others in the trading/technical outlook webinars held at 1030 GMT on Tuesday and Friday. If you are looking for ideas and feedback on how to improve your overall approach to trading, join me on Thursday each week for the Becoming a Better Trader webinar series.
Resources for Forex & CFD Traders
Whether you are a new or experienced trader, we have several resources available to help you; indicator for tracking trader sentiment, quarterly trading forecasts, analytical and educational webinars held daily, trading guides to help you improve trading performance, and one specifically for those who are new to forex.
---Written by Paul Robinson, Market Analyst
You can follow Paul on Twitter at @PaulRobinsonFX


