


USD/PHP, USD/SGD, USD/MYR, USD/IDR - Talking Points
- The Fed catalyzed further weakness in US Dollar vs ASEAN FX
- Philippine Peso, Singapore Dollar eyeing technical breakouts
- USD/MYR may extend selloff, USD/IDR looks to consolidation
Philippine Peso Technical Outlook
After Wednesday’s Fed rate decision and press conference with Chair Jerome Powell, the US Dollar has been weakening. Not just against the majors, but also versus its ASEAN counterparts – as expected. USD/PHP recently broke under a near-term rising channel as prices now look to test a daily close under 50.72. That may resume the dominant downtrend since August as the Philippine Peso aims for the November low at 50.40. Beyond that sits the 38.20% Fibonacci extension at 50.22.

USD/PHP Daily Chart

USD/PHP Chart Created in TradingView
Singapore Dollar Technical Outlook
The Singapore Dollar has also resumed its advance against the US Dollar. USD/SGD is looking to confirm a daily close under rising support from January – blue line on the chart below. Standing in its way however is the psychological barrier between 1.3558 and 1.3569 which consists of November lows. Taking out these two points of interest exposes the lows from June. Positive RSI divergence shows fading downside momentum which can at times precede a turn higher or translate into consolidation.
Learn more about how the MAS conducts monetary policy and what matters for the Singapore Dollar !
USD/SGD Daily Chart

USD/SGD Chart Created in TradingView
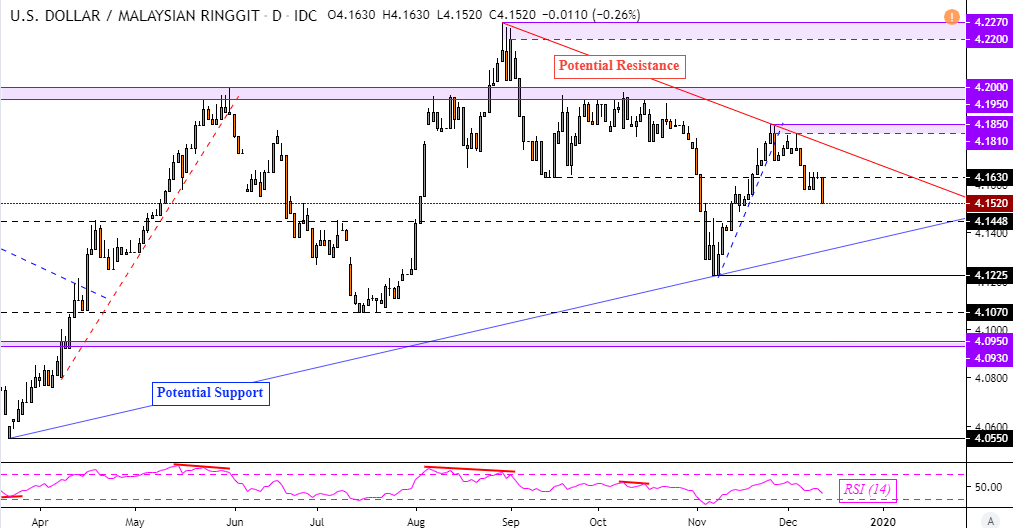
Malaysian Ringgit Technical Outlook
This is as the Malaysian Ringgit appreciated after prices took out near-term rising support during the final week of November. USD/MYR has since prolonged its descent, taking out 4.1630 and leaving behind that could be potential falling resistance from August – red line on the chart below. Further losses may see the currency pair make its way to a potential rising trend line from March – blue line. Getting there involves taking out 4.1448.
To stay updated on fundamental developments for ASEAN currencies, follow me on Twitter here @ddubrovskyFX
USD/MYR Daily Chart
Indonesian Rupiah Technical Outlook
Despite the breach above falling resistance from May, the Indonesian Rupiah was soon on the advance against the US Dollar. This made for a false breakout as USD/IDR left behind a key psychological barrier between 14115 to 14130. After near-term losses, the pair paused its descent on a rising support from September – blue line on the chart below. Without confirmation of a downside breakout, this could spell for further consolidation to come as prices sit under 14035.
USD/IDR Daily Chart

USD/IDR Chart Created in TradingView
FX Trading Resources
--- Written by Daniel Dubrovsky, Currency Analyst for DailyFX.com
To contact Daniel, use the comments section below or @ddubrovskyFX on Twitter


