


NORDIC FX, NOK, SEK WEEKLY OUTLOOK
- USDSEK is advancing to retest formidable 18-month support-turned-resistance
- EURSEK is approaching 2-month descending support channel: will it break it?
- Is USDNOK finally gaining adequate momentum to breach congestive range?
See our free guide to learn how to use economic news in your trading strategy !
USDSEK TECHNICAL ANALYSIS
In last week’s technical forecast, USDSEK was retreating below 18-month rising support channel (red parallel lines) though traders appeared to have lost resolve to continue lower. Since then, the pair has been oscillating between the lower crust of the former-support-turned-resistance and upper lip of the 9.2533-9.31110 support zone (red dotted lines).
USDSEK – Daily Chart
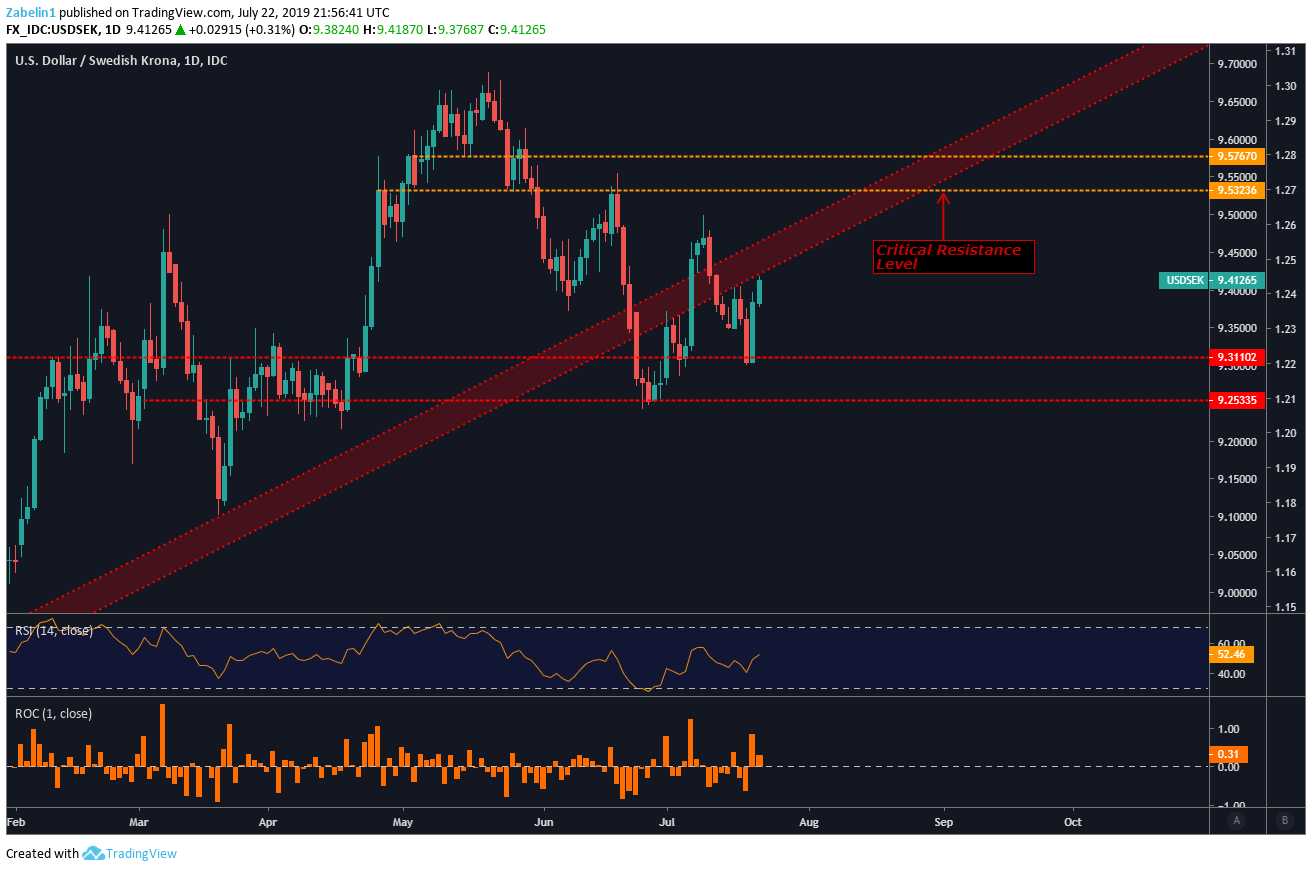
While the directional preference for the pair supports the notion of an underlying bullish bias, short-term deviations should be expected, especially this week. To learn more about these factors, see my weekly fundamental forecast. If the pair trade above critical support with follow-through, traders nay be tempted to enter long positions. But a fair warning: upside momentum may encounter significant resistance at 9.5323.
EURSEK TECHNICAL ANALYSIS
EURSEK is making a bold stride into the 2-month descending resistance channel (red parallel lines), though traders may find themselves waiting for a daily close above the barrier with follow-through. The last time the pair reached this depth into the zone was on July 11 before capitulating. The pair is comfortably above support at 10.4996 though this assurance may be wiped away by the ECB’s rate decision and commentary this week.
Want to learn more about European markets? Be sure to follow me on Twitter @ZabelinDimitri.
EURSEK- Daily Chart

USDNOK TECHNICAL ANALYSIS
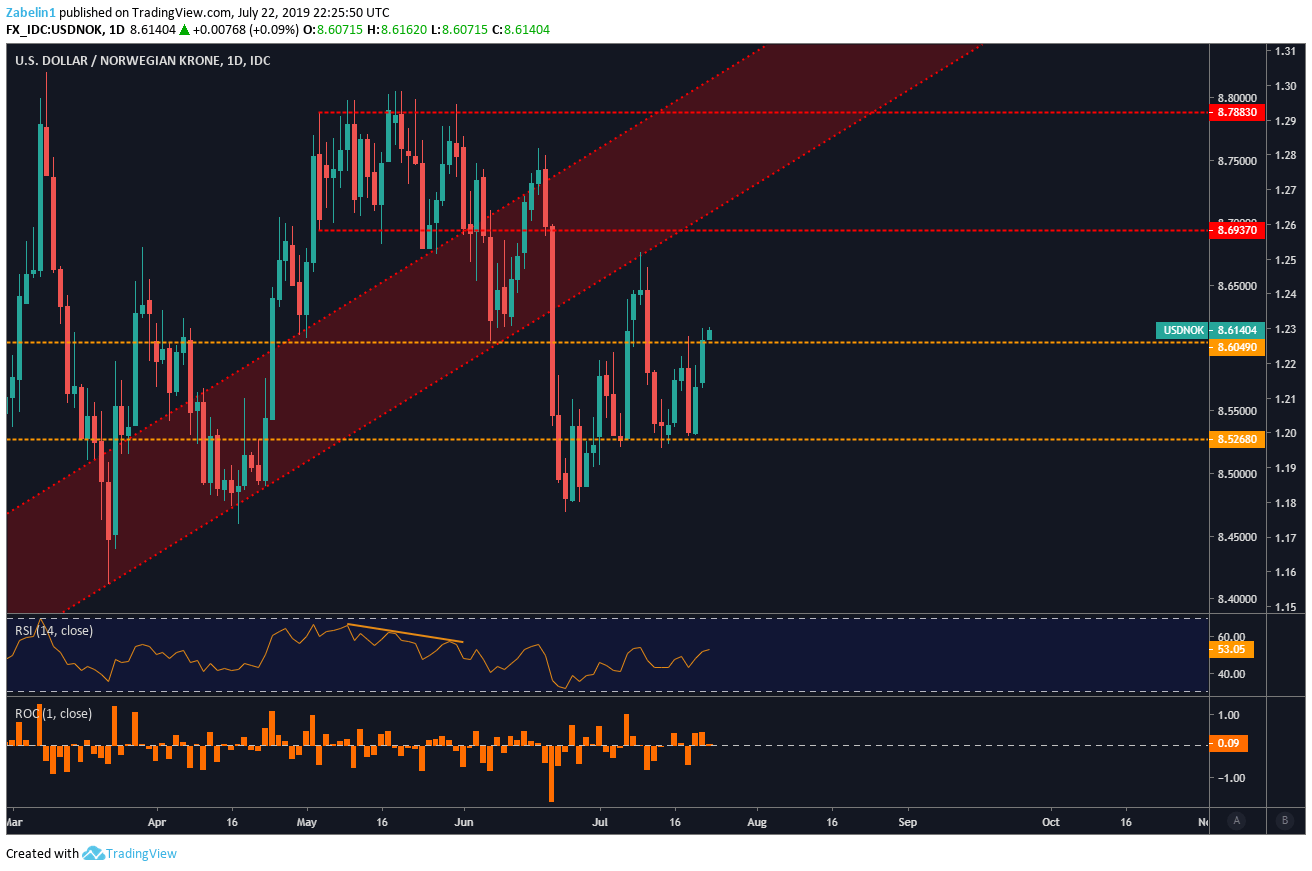
After stubbornly trading with the wide 8.5268-8.6049 range (yellow dotted lines) USDNOK appears to now be shyly trying to reach above the upper crust. The last time the pair did this was back in early July, though the extended wicks and short-bodied candles indicated a lack of resolve. The next level of resistance will likely be at 8.6937. Despite the deviation, the fundamental outlook still favors a stronger USDNOK.
USDNOK – Daily Chart
SWEDISH KRONA, NORWEGIAN KRONE TRADING RESOURCES
- Join a freewebinar and have your trading questions answered
- Just getting started? See our beginners’ guide for FX traders
- Having trouble with your strategy? Here’s the #1 mistake that traders make
--- Written by Dimitri Zabelin, Currency Analyst for DailyFX.com
To contact Dimitri, use the comments section below or @ZabelinDimitri on Twitter


