


ASEAN Technical Outlook – USD/PHP, USD/SGD, USD/IDR, USD/MYR
- Malaysian Ringgit and Indonesian Rupiah face reversal candlestick patterns
- USD/PHP kept falling but is overshadowed by fading downside momentum
- The Singapore Dollar overturned a reversal pattern as it sits within support
We released our Q1 forecasts for currencies like the US Dollar in the DailyFX Trading Guides page
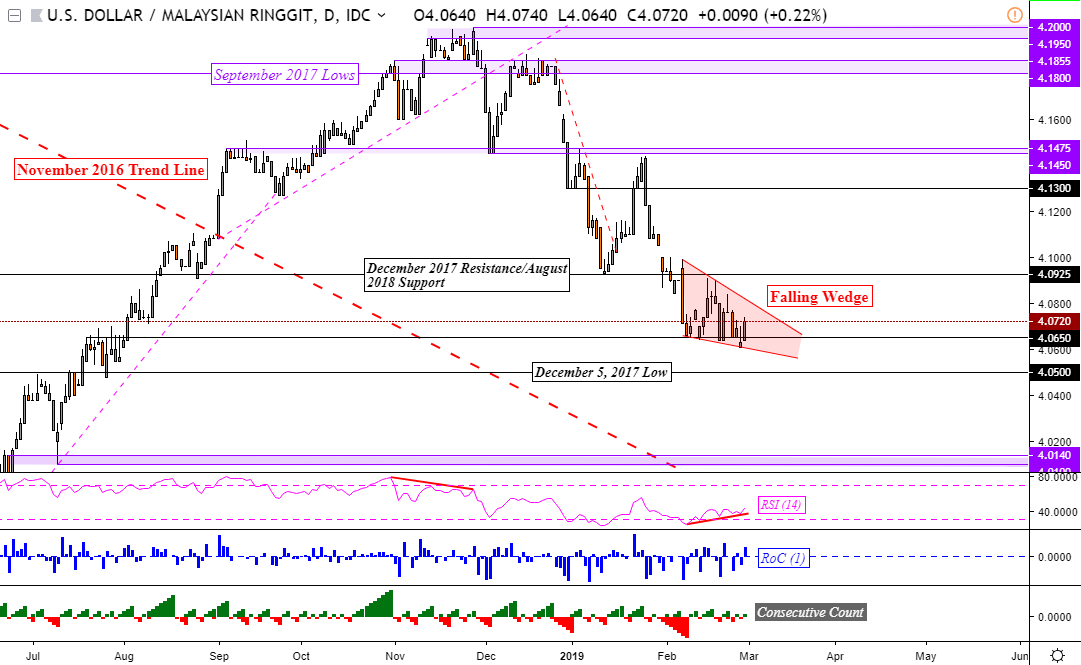
USD/MYR Technical Analysis – Bullish Reversal Pattern Brewing
The Malaysian Ringgit struggled to breach support against the US Dollar at 4.0650 as expected. Positive RSI divergence overshadowed USD/MYR’s attempt to resume the dominant downtrend. This showed fading downside momentum and it could precede a turn higher. Furthermore, a falling wedge candlestick pattern is brewing. This is typically a bullish reversal pattern. A turn higher would place near-term resistance at 4.0925. For updates on the ASEAN pairs that I am closely watching, you may follow me on Twitter @ddubrovskyFX for updates in the interim.
USD/MYR Daily Chart
USD/IDR Technical Analysis – Inverse Head and Shoulders
Another bullish reversal pattern seems to be brewing in an ASEAN currency, the Indonesian Rupiah. USD/IDR’s downtrend is overshadowed by an inverse head and shoulders candlestick formation. Prices have just rebounded on the right shoulder, aiming towards the neckline which is sloping downward from January highs. Pushing above this would open the door to testing resistance at 14396. Meanwhile, clearing support exposes the head of the formation which is a range between 13848 – 13923. With that said, IDR weakness could be fundamentally countered by intervention from the Bank of Indonesia.
USD/IDR Daily Chart

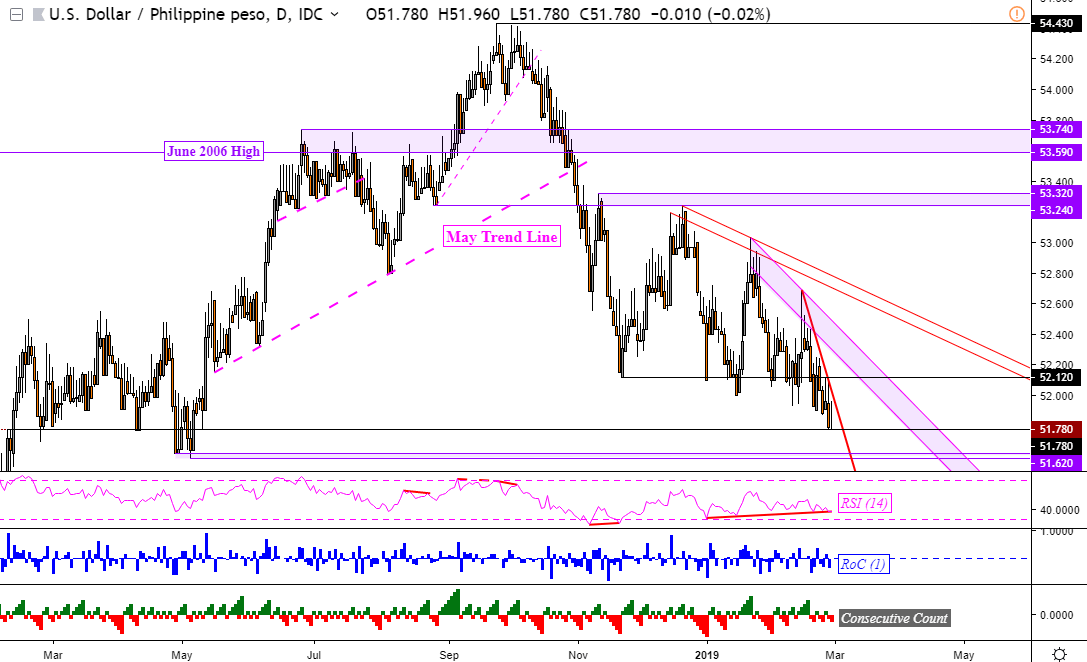
USD/PHP Technical Analysis – Fading Downside Momentum
USD/PHP cleared a support range between 51.93 and 52.00 pointed out last week, opening the door to resuming the dominant downtrend. However, positive RSI divergence is showing here too which ought to be a sign of caution for Philippine Peso bulls. The pair is sitting right on 51.78 which was a support area from February to April 2018. If it holds, the pair may climb to test the near-term falling resistance line from the middle of February 2019. Otherwise, descending exposes support at 51.62 next.
USD/PHP Daily Chart
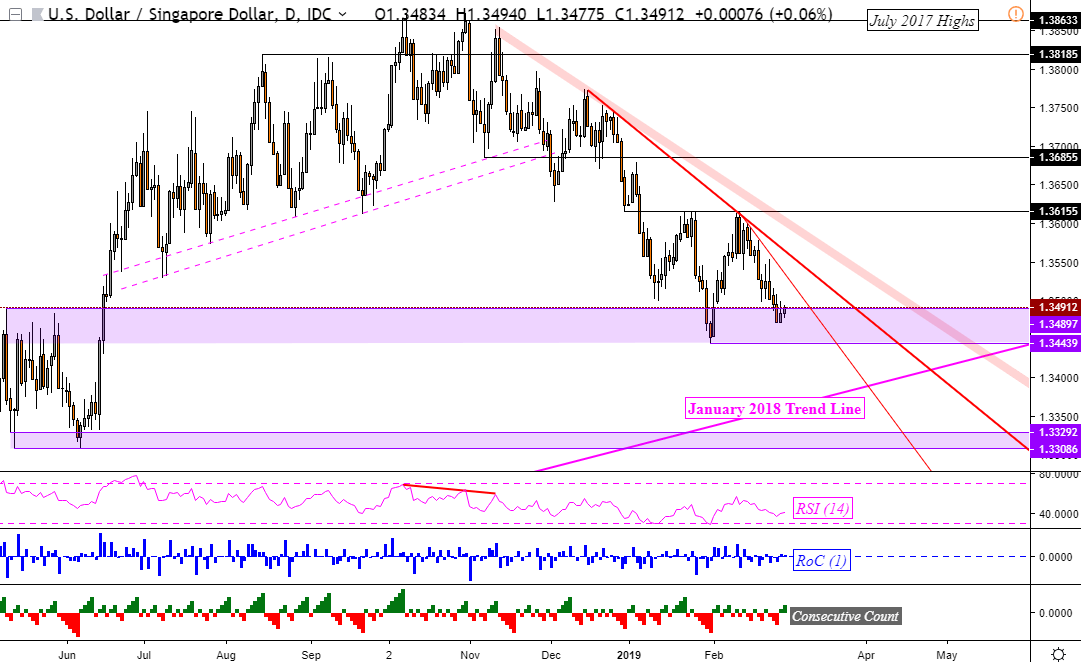
USD/SGD Technical Analysis – Bullish Reversal Pattern Fell Apart
Last week, I noted an inverse head and shoulder in USD/SGD. Since then, the Singapore Dollar gained against its US counterpart as it overturned the candlestick formation. It remains within a support range between 1.3443 and 1.3489. Clearing it would expose the rising trend line from January 2018. On the other hand, if USD/SGD turns higher, then it must contend with multiple descending resistance lines pointed out on the chart below.
USD/SGD Daily Chart
**All Charts Created in TradingView
Read this week’s ASEAN fundamental outlook to learn about the underlying drivers for these currencies!
FX Trading Resources
- Just getting started? See our beginners’ guide for FX traders
- Having trouble with your strategy? Here’s the #1 mistake that traders make
- See how the US Dollar is viewed by the trading community at the DailyFX Sentiment Page
--- Written by Daniel Dubrovsky, Junior Currency Analyst for DailyFX.com
To contact Daniel, use the comments section below or @ddubrovskyFX on Twitter


