


ASEAN Technical Outlook – USD/PHP, USD/SGD, USD/IDR, USD/MYR
- USD/IDR attempting a break under the 2018 rising trend line, dominant uptrend at risk
- USD/SGD and USD/PHP are aiming higher but face critical areas of resistance ahead
- USD/MYR upside push struggled and a new resistance range formed, now consolidating
We released our 4Q forecasts for currencies like the US Dollar in the DailyFX Trading Guides page
USD/IDR Technical Analysis – Dominant Uptrend At Risk
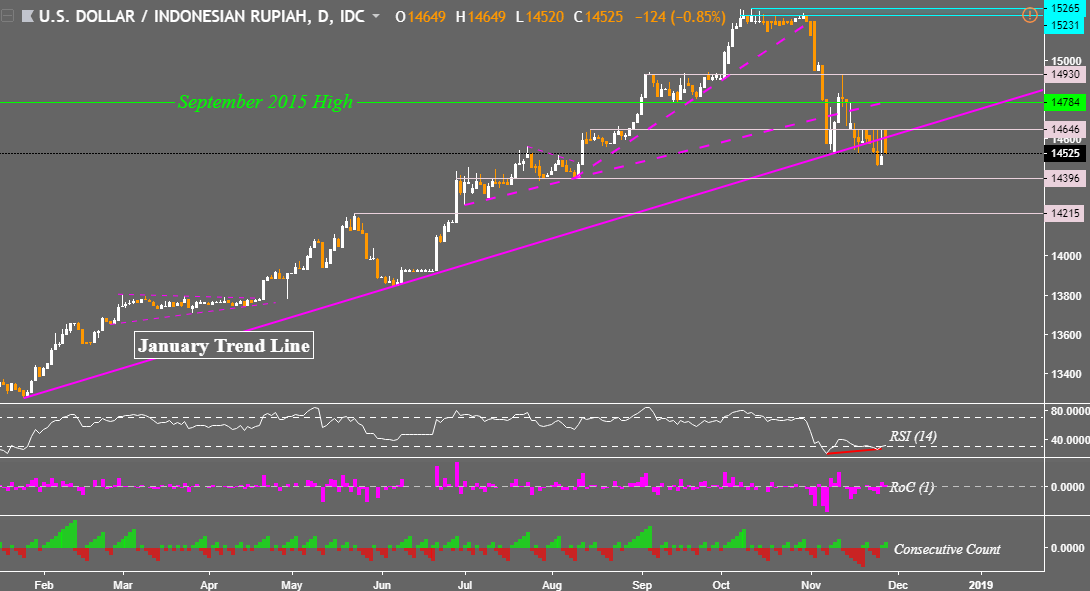
The Indonesian Rupiah has spent most of this year so far depreciating against the US Dollar, that may be on the verge of changing. Looking at the USD/IDR daily chart below, the pair has broken through the rising trend line from January. Granted, the Rupiah has been struggling in maintaining its progress and positive RSI divergence warns that downside momentum is ebbing which may precede a turn higher.
With that in mind, perhaps a close under 14,396 may confirm a lasting descent to come. This price has acted as resistance and support from June to August. Falling through it exposes 14,215 afterwards. Should USD/IDR struggle in maintaining its downside break, near-term resistance appears to be at 14,646. A push above that opens the door to testing the September 2015 high at 14,784.
USD/IDR Daily Chart
USD/SGD Technical Analysis – Heading Towards Resistance, Still in Consolidation Mode
Generally speaking, the Singapore Dollar has largely been in consolidation mode against its US counterpart with a slight bias to the upside. This is largely thanks to a rising range of support dating back to July. It looks as though resistance will be coming under fire again next. USD/SGD support held between 1.3718 and 1.3685 and now the pair is heading for the August and September highs around 1.38185. Still, even a push above that leaves the July 2017 highs as resistance next. An ascent through that may open the door to uptrend resumption.
USD/SGD Daily Chart

USD/PHP Technical Analysis – Sitting Squarely at Resistance
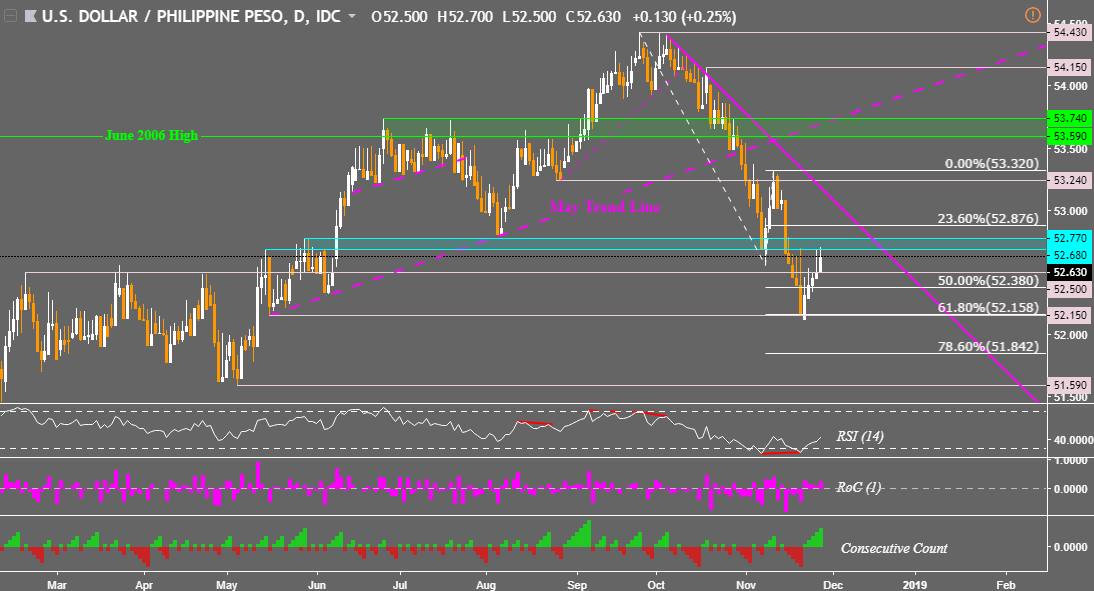
Last time when I looked at the Philippine Peso, positive RSI divergence warned that USD/PHP might have been on the verge of rising. That was indeed the case. While the pair made upside progress in recent days, prices stopped short of the horizontal range of former support now resistance between 52.77 and 52.68. Until this area is breached, it may be too soon to argue that the pair is heading for a lasting reversal of the downtrend since October. A push above that though would expose a descending trend line from then.
USD/PHP Daily Chart
USD/MYR Technical Analysis – Back in Consolidation Mode
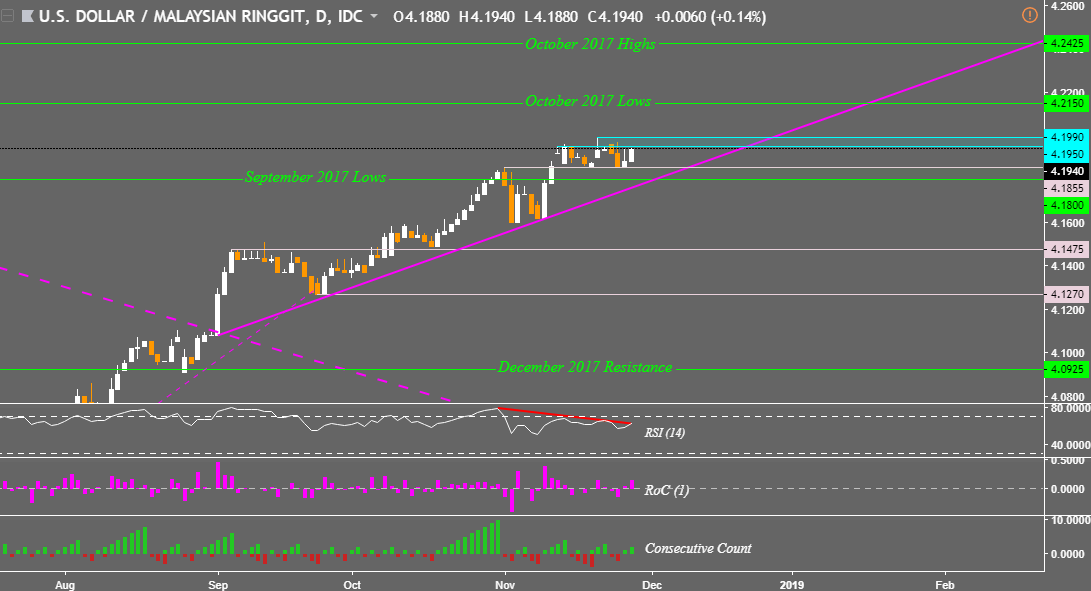
When I covered USD/MYR last, the pair was attempting an upside break towards the October 2017 lows. The push ultimately failed and left behind a new range of resistance between 4.1990 and 4.1950. The Malaysian Ringgit is also sitting right above the September 2017 lows at 4.18. With that in mind, USD/MYR remains in consolidation mode. Do note that negative RSI divergence is present here. Though a turn lower would involve clearing a rising support line from September which may result in a lasting reversal.
USD/MYR Daily Chart
**All Charts Created in TradingView
Read this week’s ASEAN fundamental outlook to learn about the underlying drivers for these currencies!
FX Trading Resources
- Just getting started? See our beginners’ guide for FX traders
- Having trouble with your strategy? Here’s the #1 mistake that traders make
- See how the US Dollar is viewed by the trading community at the DailyFX Sentiment Page
--- Written by Daniel Dubrovsky, Junior Currency Analyst for DailyFX.com
To contact Daniel, use the comments section below or @ddubrovskyFX on Twitter


