


ASEAN Technical Outlook – USD/PHP, USD/SGD, USD/IDR, USD/MYR, RSI Divergence
- Philippine Peso strength may pause in the days ahead as downside momentum is fading
- Malaysian Ringgit kept depreciating despite reversal warning signs, at new 2018 highs
- USD/IDR uptrend holds given stubborn support, may climb next. USD/SGD oscillating
We released our 4Q forecasts for currencies like the US Dollar in the DailyFX Trading Guides page
USD/PHP Technical Analysis – Downtrend Accelerates
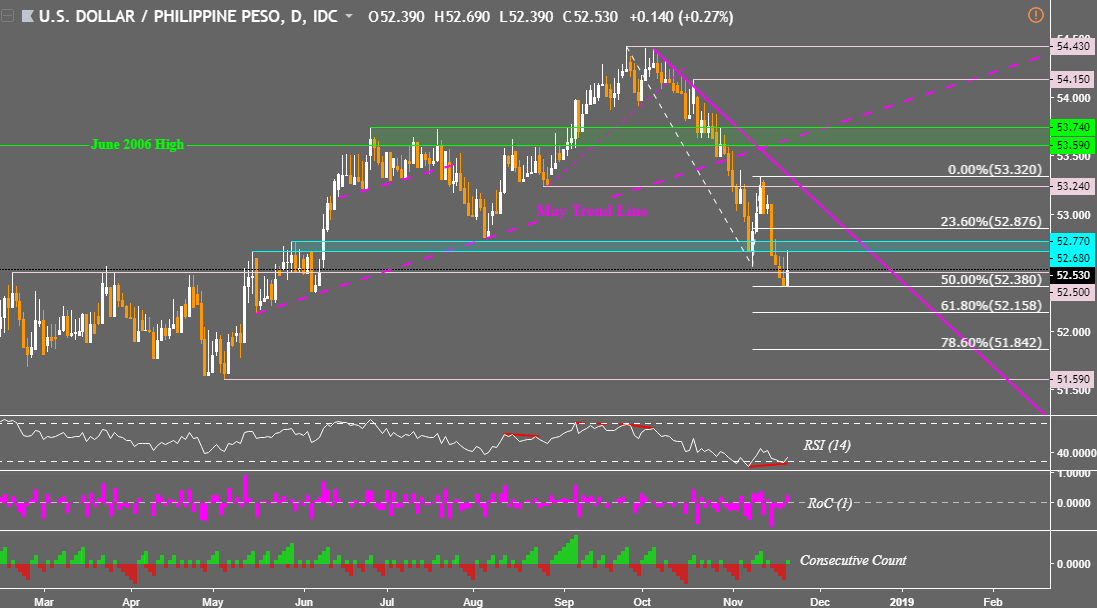
The US Dollar struggled appreciating against the Philippine Peso since we last looked at USD/PHP. The pair resumed its dominant downtrend from October, knocking out a horizontal range of support between 52.68 and 52.70. This has exposed the May low at 51.90 but getting there requires descending through Fibonacci extension levels on the chart below. The first one is the 50% midpoint at 52.38 followed by 52.15 before targeting 51.84. Positive RSI divergence warns that downside momentum is ebbing and it may precede a correction.
USD/PHP Daily Chart
USD/MYR Technical Analysis – Uptrend Resuming?
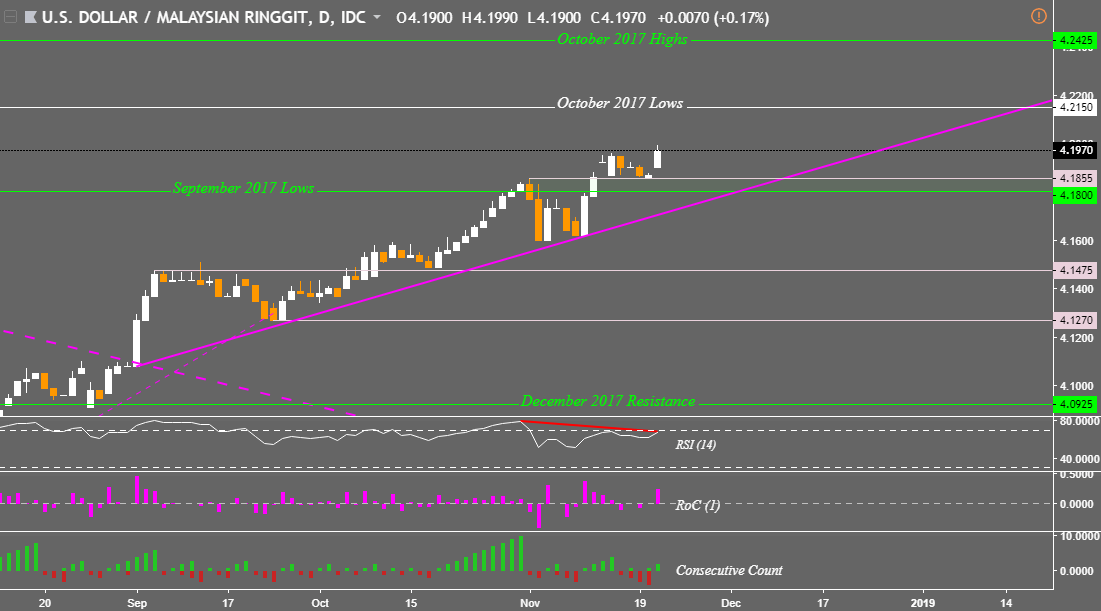
Last week’s gravestone doji candle in USD/MYR, which indicated indecision, failed to spark a bearish reversal. Near-term support held at 4.1855 which is just above the September 2017 lows. Since then, the US Dollar climbed to a new high this year against the Malaysian Ringgit.
This exposed the October 2017 lows around 4.2150 which may act as near-term resistance next. However, negative RSI divergence still shows that upside momentum is fading. Should USD/MYR turn lower, it will have to descend through 4.18 to stand a chance at testing the rising trend line from September.
USD/MYR Daily Chart
USD/IDR Technical Analysis – Dominant Uptrend Holds
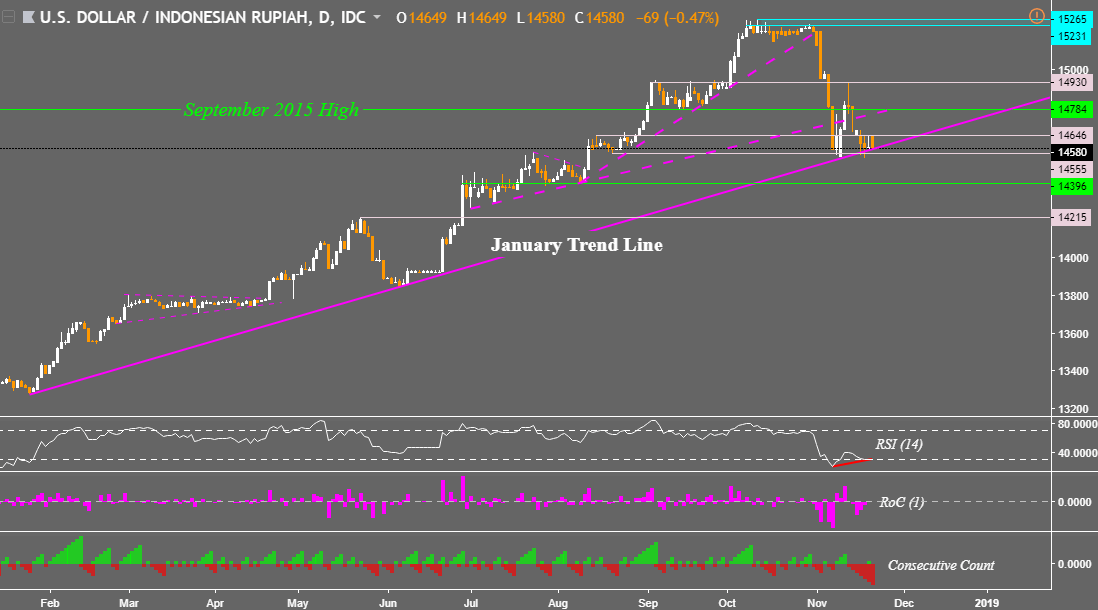
While the Indonesian Rupiah appreciated against the US Dollar since we last looked at USD/IDR, the rising trend line from January is still keeping the dominant uptrend intact. Should the pair fall through it, confirmation of a break will be needed. Ideally, this would be via a close under the November 9th low at 14,535. Positive RSI divergence however shows that downside momentum is waning and it may precede a turn higher as support holds. This would have the September 2015 high in sight as near-term resistance.
USD/IDR Daily Chart
USD/SGD Technical Analysis – Still in Consolidation
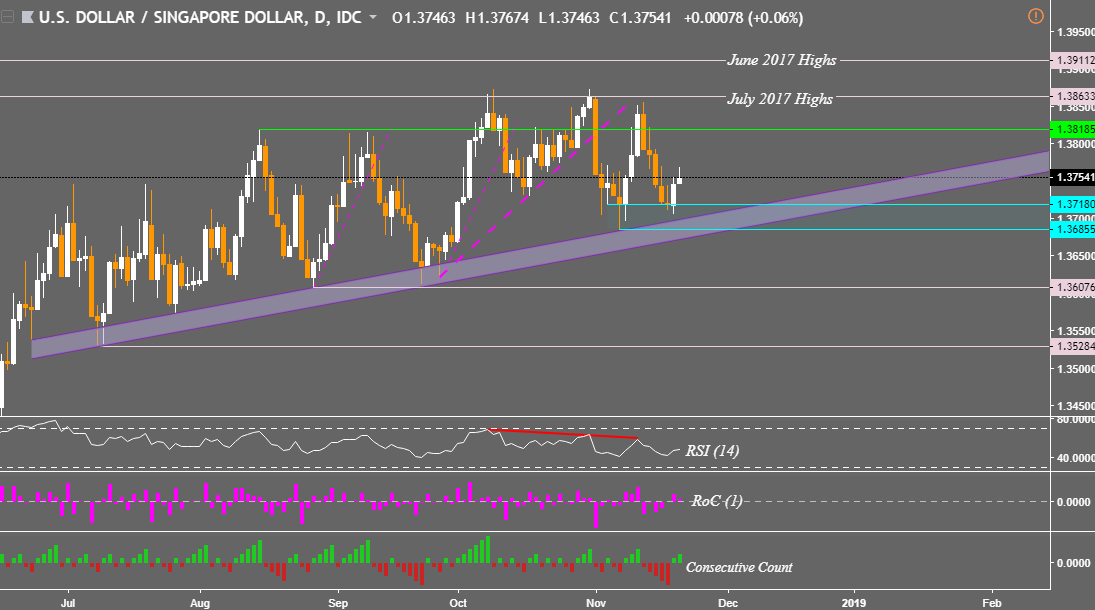
As anticipated, negative RSI divergence preceded a turn lower in USD/SGD. However, the US Dollar failed to fall through a horizontal barrier between 1.3718 and 1.36855 against its Singaporean counterpart. Furthermore, a rising channel from June is also keeping the dominant uptrend holding together. With that in mind, USD/SGD still remains in consolidation mode. Immediate resistance is at 1.38185 which consists of the August and September highs. Climbing above that exposes the July 2017 highs around 1.38185.
USD/SGD Daily Chart
**All Charts Created in TradingView
Read this week’s ASEAN fundamental outlook to learn about the underlying drivers for these currencies!
FX Trading Resources
- Just getting started? See our beginners’ guide for FX traders
- Having trouble with your strategy? Here’s the #1 mistake that traders make
- See how the US Dollar is viewed by the trading community at the DailyFX Sentiment Page
--- Written by Daniel Dubrovsky, Junior Currency Analyst for DailyFX.com
To contact Daniel, use the comments section below or @ddubrovskyFX on Twitter


