


The US Dollar Index (DXY) found support at two-month trend-line support but has bearish price pattern potential. USD/CAD is a pair I looked at in the Tuesday webinar due to its steady trend-line, with it continued to be tested will it eventually fail? USD/MXN could be on the verge of rolling over from a trend-line dating back to the peak created in January 2017. Crude oil may be on the verge of rallying as descending wedge forms. Gold is up against trend-line resistance, on weakness will have trend support quickly showing up; could get jammed up a bit more before breaking one way or the other.
Technical Highlights:
- US Dollar Index (DXY) trend-line support/H&S potential
- USD/CAD clear trend-line support, hold or fold soon?
- USD/MXN decision time coming at January 2017 trend-line
- Crude oil descending wedge may soon mark short-term bottom
- Gold price may get bottled up some more before making a move
See where our team of analysts think your favorite markets and currencies are headed into year-end in the DailyFX Q4 Forecasts
US Dollar Index (DXY) trend-line support/H&S potential
The US Dollar Index (DXY) bounced off trend-line support earlier this week, and while the line from September keeps price pointed higher there is potential for more weakness if a developed ‘head-and-shoulders’ forms. The only issue with a bearish outlook, though, should we see the neckline (which is also the trend-line from Sep) break, is that it won’t be long before the April trend-line is tested. So while there could be some weakness it will pay to watch how price action plays out should the longer, more important level of support is met. The thinking on this end is that DXY might want to continue to lack strong conviction either way through year-end.
US Dollar Index (DXY) 4-hr Chart (T-lines, H&S possibility)

See what key fundamental and technical factors are expected to drive the US Dollar through year-end in the Q4 USD Forecast
USD/CAD clear trend-line support, hold or fold soon?
In Tuesday’s webinar, I looked at USD/CAD and basically said, while conviction was lacking from either side the clear trend-line support on the 4-hr chart offers traders a line to lean on whether it was to stay with the trend higher or for those would-be shorts who are waiting for a stronger signal before entering. The repeated test in close proximity to one another is making the line increasingly important and perhaps weaker. Stay on or above and must respect the trend, but if it breaks a fair amount of sudden selling could come in.
USD/CAD 4-hr Chart (T-line repeated testing)

USD/MXN decision time coming at January 2017 trend-line
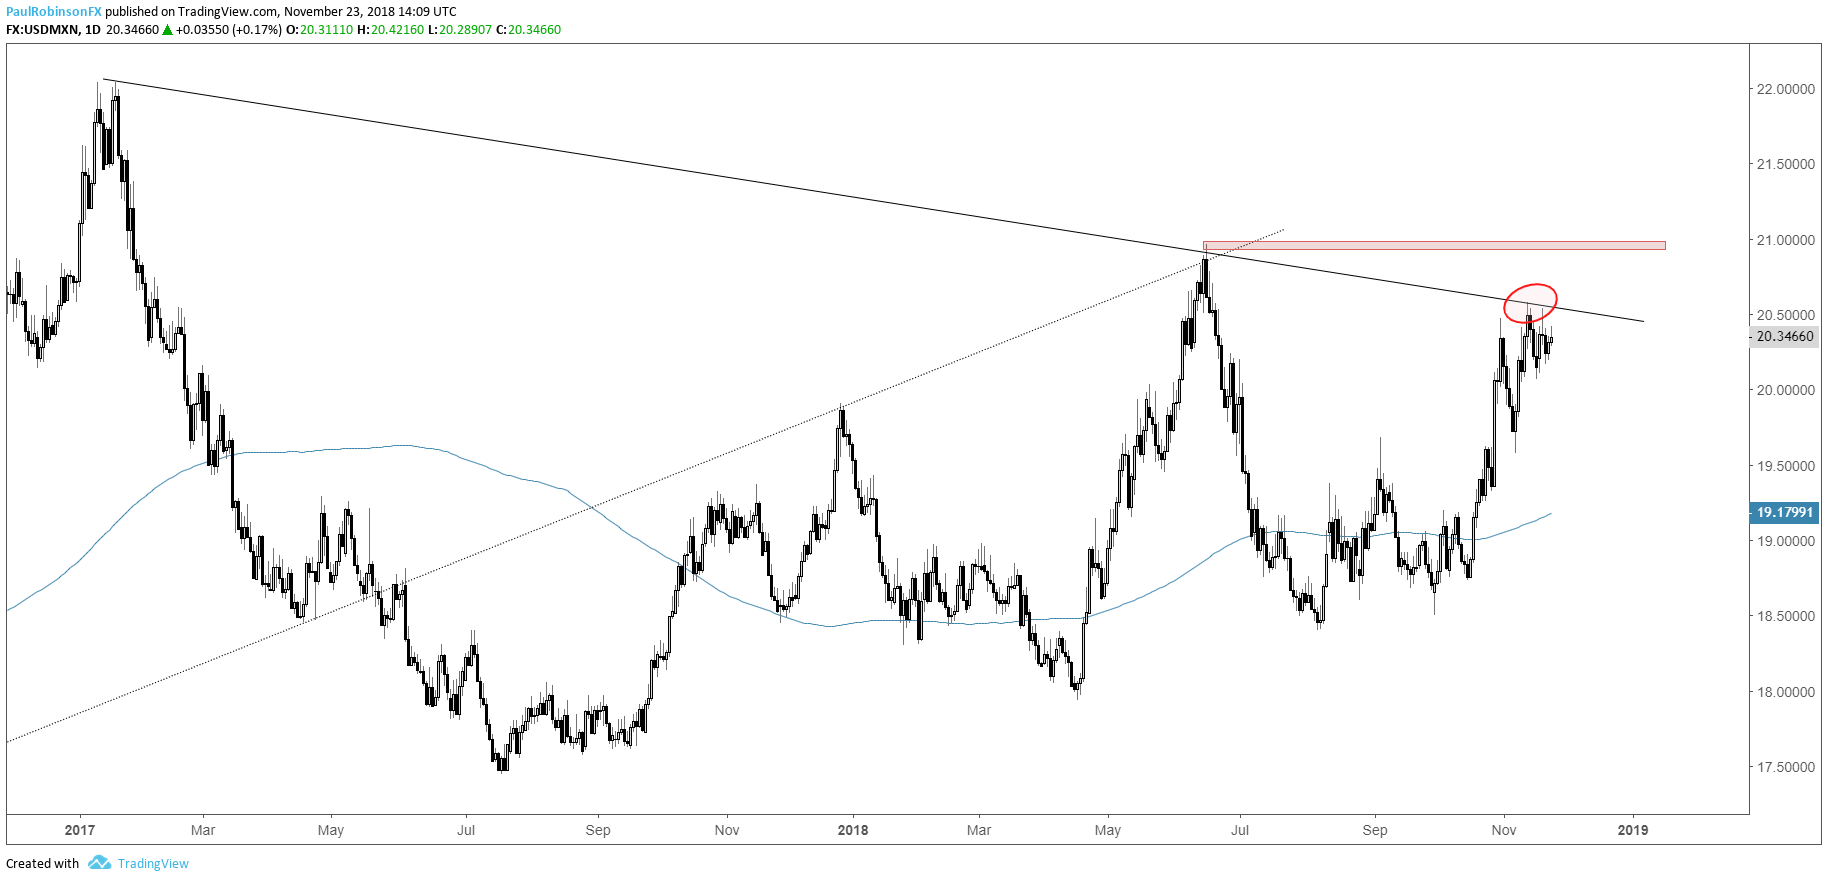
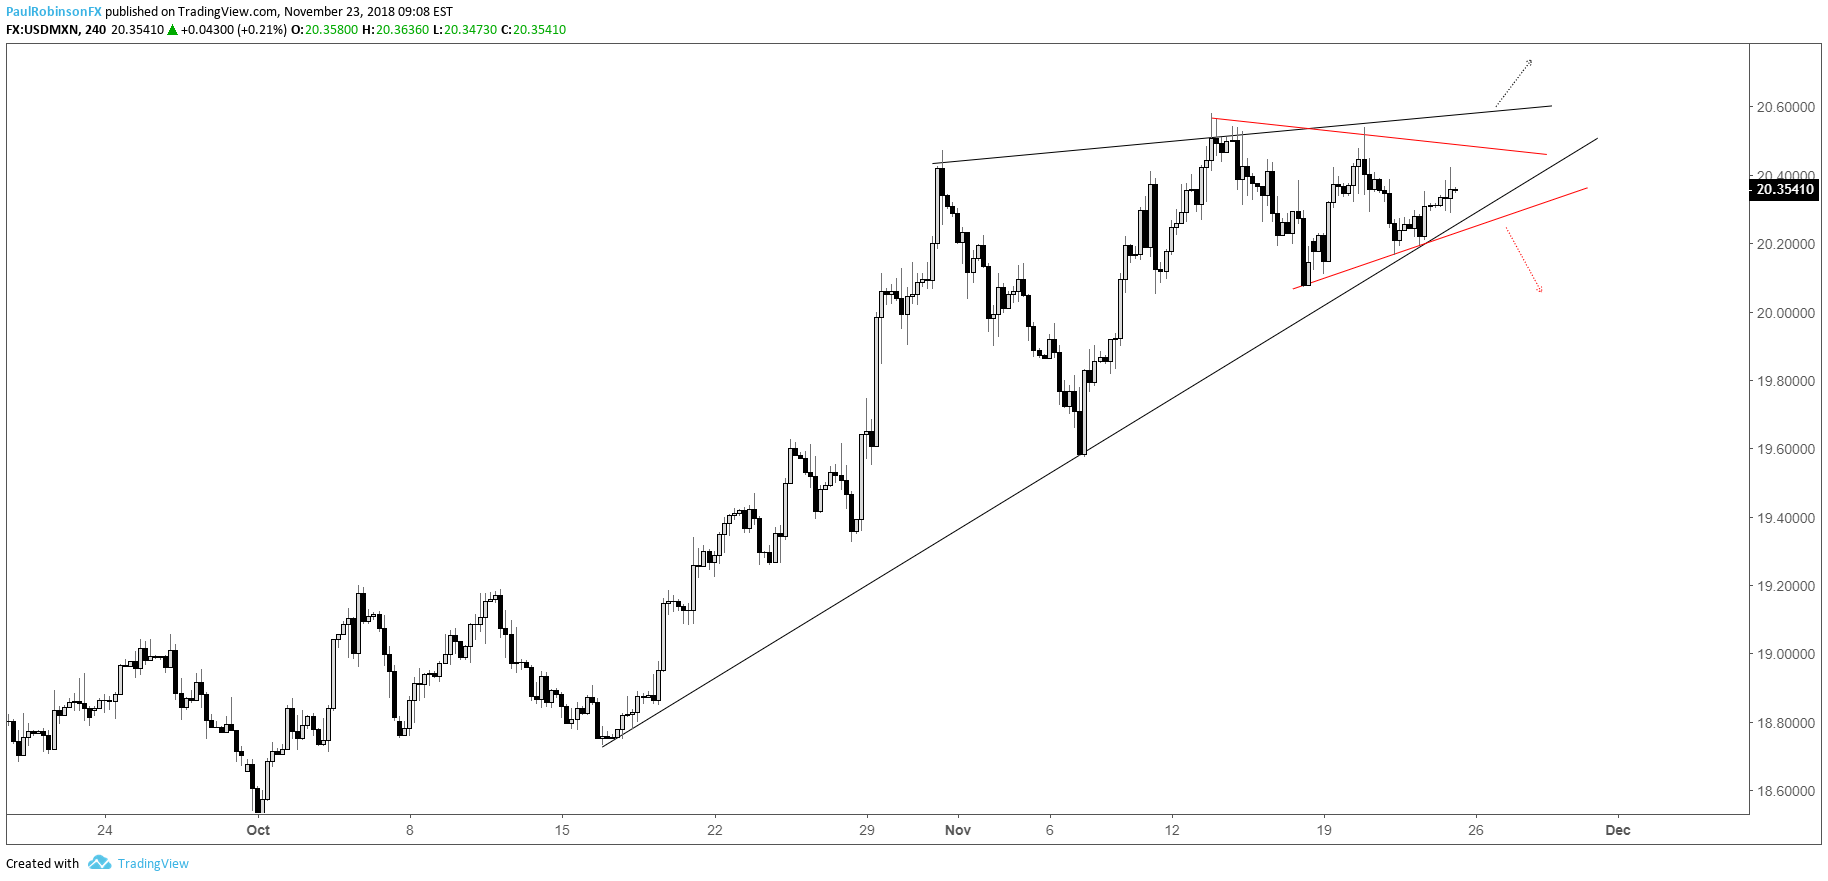
USD/MXN is pressed up against a trend-line from January 2017, and while the trend is higher since early last month, it could be losing momentum and on the verge of rolling over. An ascending wedge (and smaller triangle) may be on the build here, which could lead to either a breakout or breakdown, so a little more time is needed, but with USD/MXN at a cross-road a strong move may soon be in store. A break of the rising trend-line on the 4-hr will be considered bearish while a breakout and daily close above the trend-line bullish.
USD/MXN Daily Chart (T-line resistance)
USD/MXN 4-hr Chart (Move coming...)
Crude oil descending wedge may soon mark short-term bottom
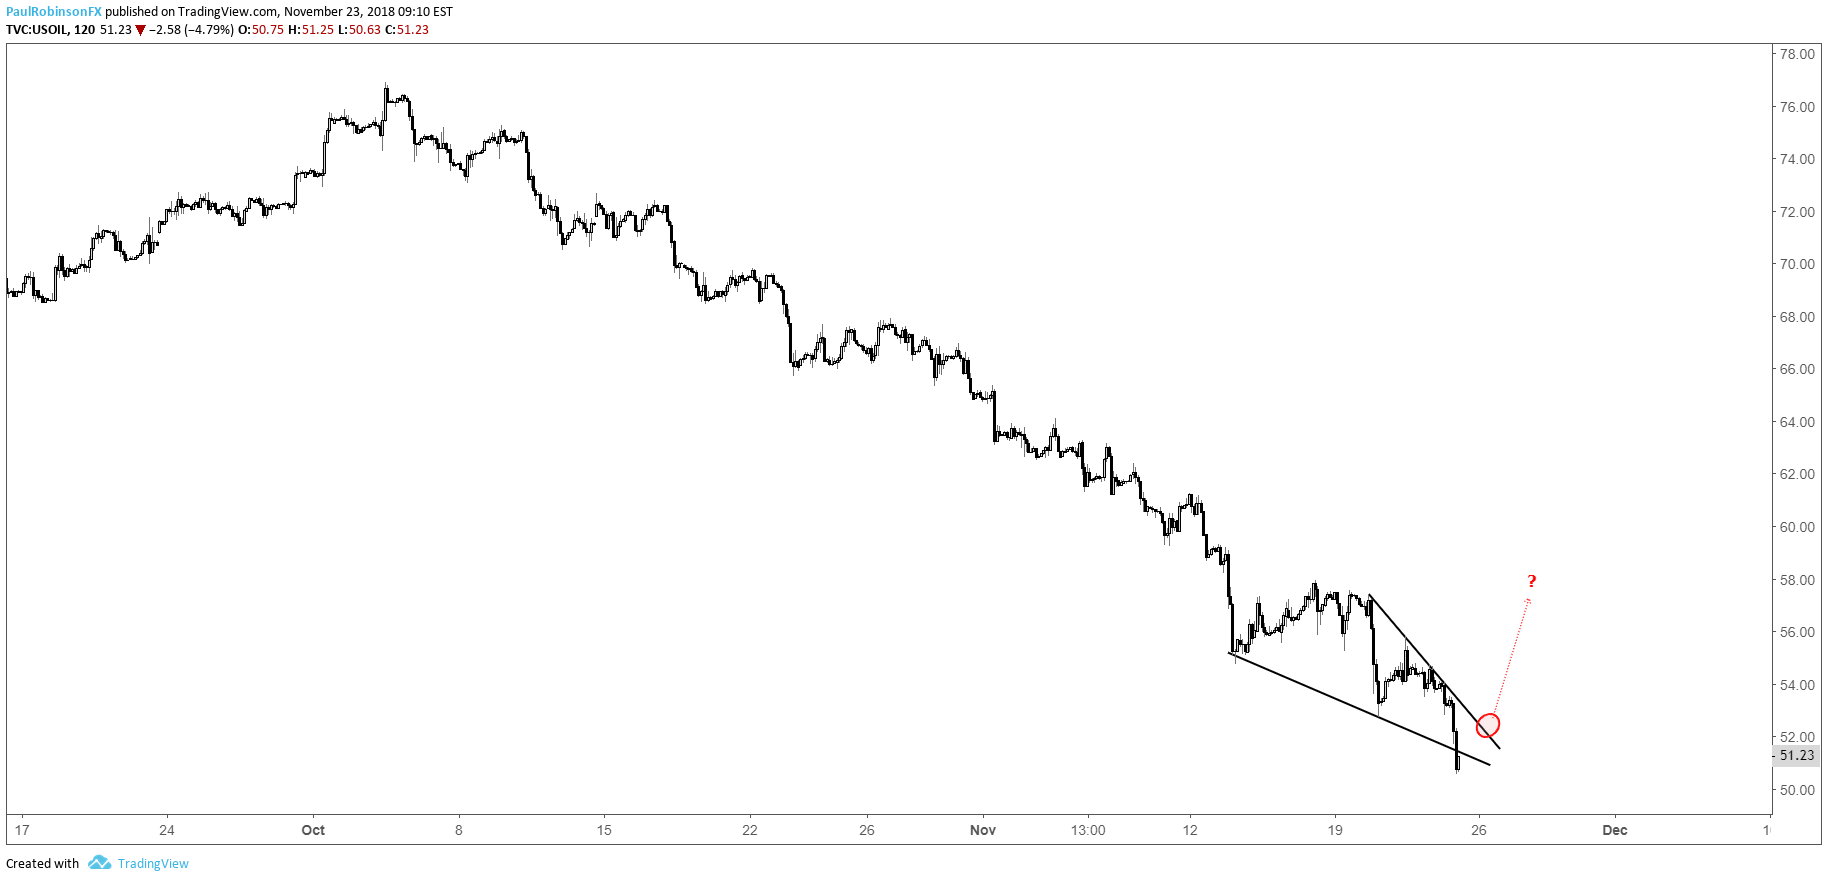
Crude oil’s sharp decline may come to a halt, at least temporarily, if it can make good on an overthrown pattern. Right now crude is trading below the underside of the wedge but it could be a head-fake before pressing higher above the top-side portion of the wedge. This is not an uncommon occurrence as the last of long’s purge before a rally ensues. This may only ignite only short-term counter-trend move back up to around 58.
Crude Oil 2-hr Chart (Descending wedge)
See what key fundamental and technical factors are expected to drive Crude Oil through year-end in the Q4 Crude Oil Forecast
Gold price may get bottled up some more before making a move
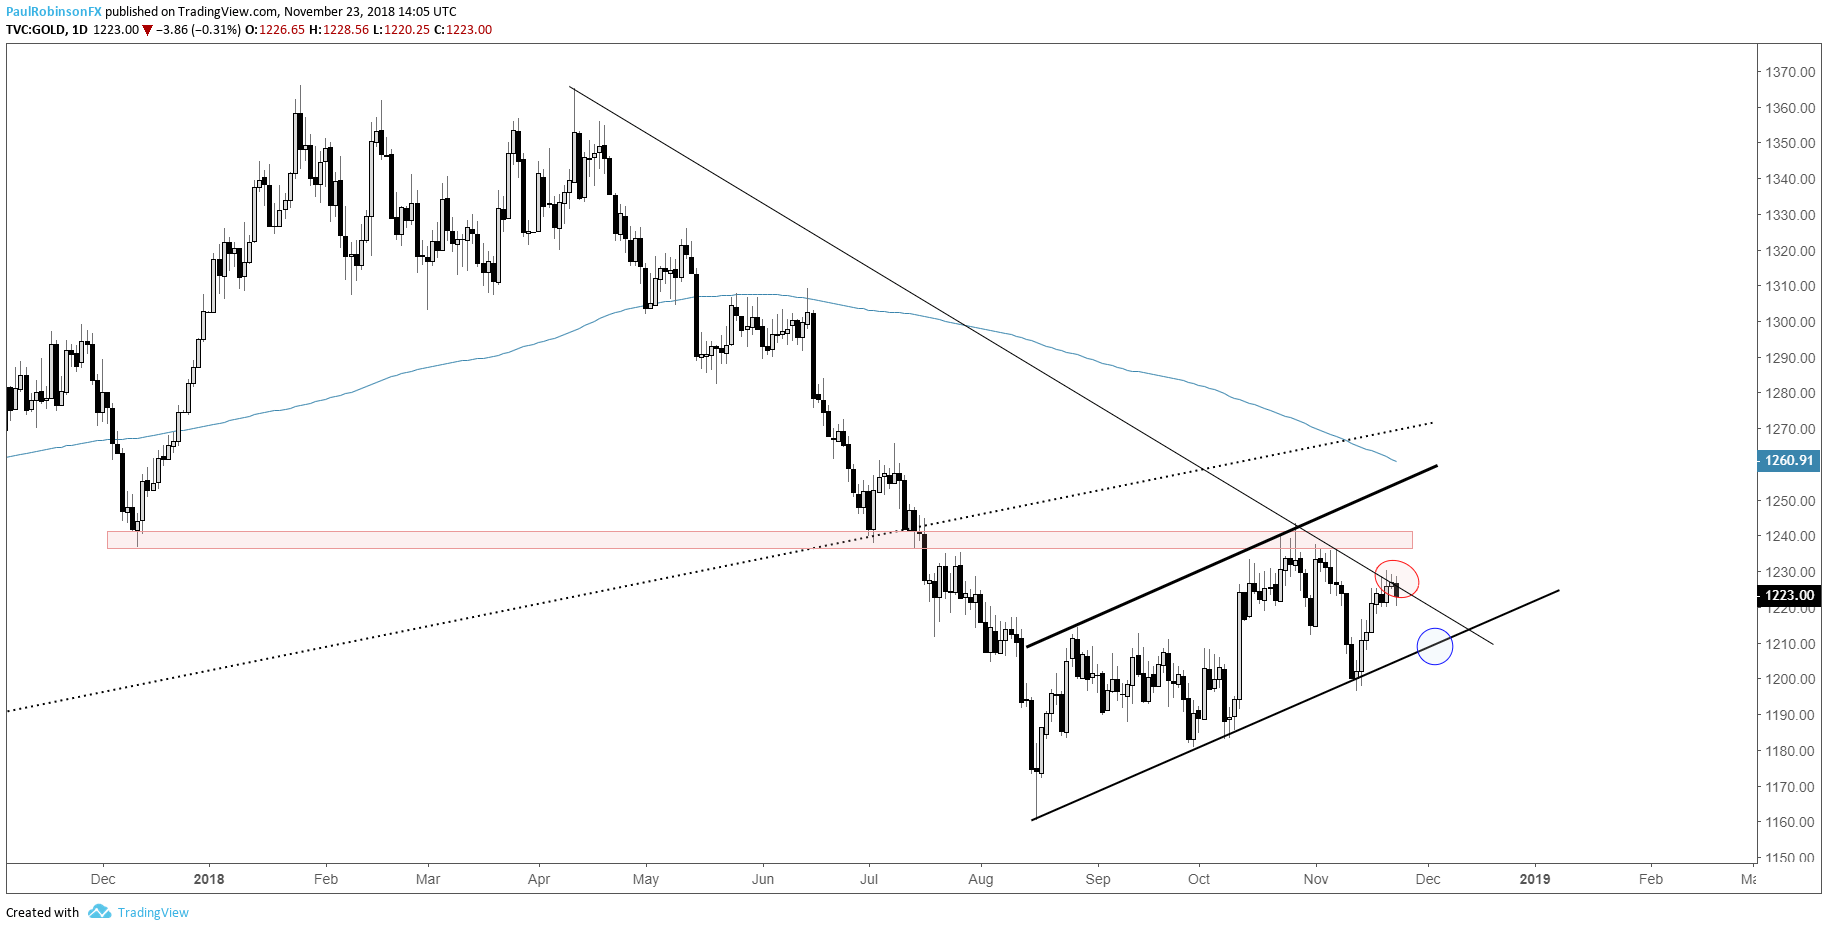
Gold is struggling at trend-line resistance from the peak created in April, which will on a downturn have the lower parallel from August quickly in focus. As discussed on Tuesday, gold may be undergoing further development of a bear-flag, however; a wedge may also develop if the lower parallel is soon reached. Either way, the trend-line from August will be important.
See what key fundamental and technical factors are expected to drive Gold through year-end in the Q4 Gold Forecast
Gold Daily Chart (Resistance and support keeping price bottled up)
Resources for Index & Commodity Traders
Whether you are a new or an experienced trader, DailyFX has several resources available to help you; indicator for tracking trader sentiment, quarterly trading forecasts, analytical and educational webinars held daily, trading guides to help you improve trading performance, and one specifically for those who are new to forex.
---Written by Paul Robinson, Market Analyst
You can follow Paul on Twitter at @PaulRobinsonFX


