


Nasdaq 100/FAANG Highlights:
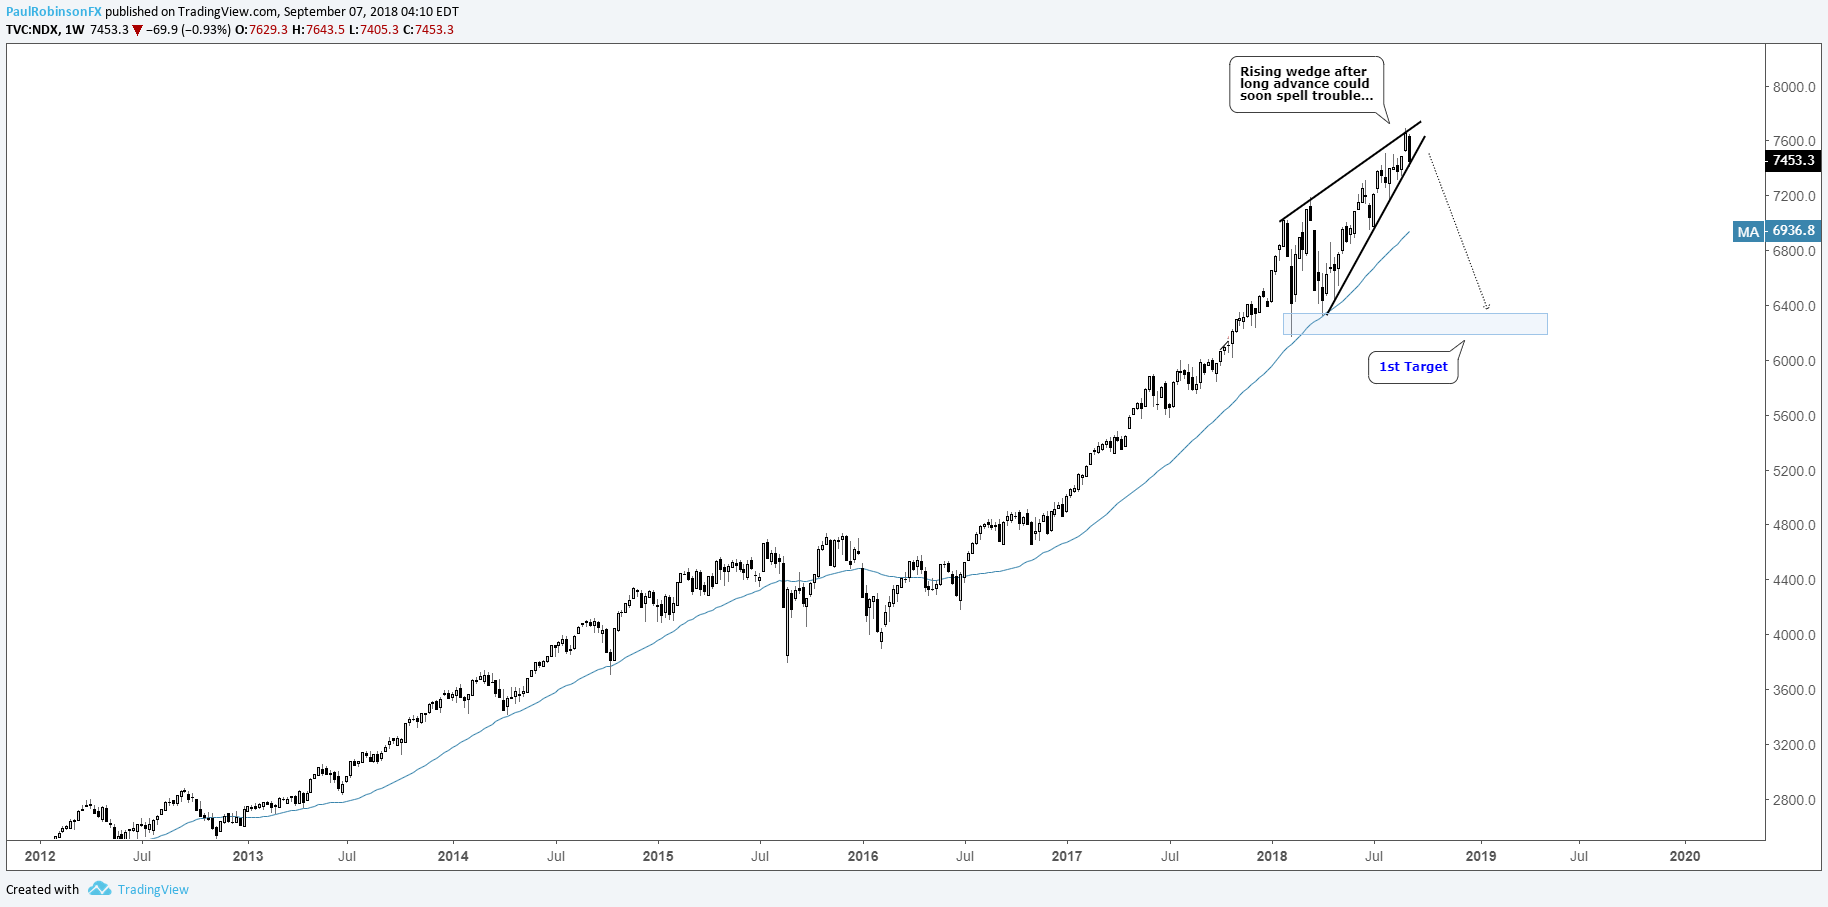
- Nasdaq 100 rising wedge very near bearish break
- Bull market darlings ‘FAANG’ showing signs of trouble
- How FAANG goes, NDX goes, rest of the market goes…
For longer-term trading ideas, Q3 forecasts, and a library of educational content, check out the DailyFX Trading Guides
Nasdaq 100 and FAANG set up to hit market
Recently, we’ve been discussing the Nasdaq 100 and the rising wedge formation its been building since the beginning of the year, however; with no bearish trigger its ominous implications have been put on the backburner. That could be about to change.
Nasdaq 100 Weekly Chart (Rising wedge)
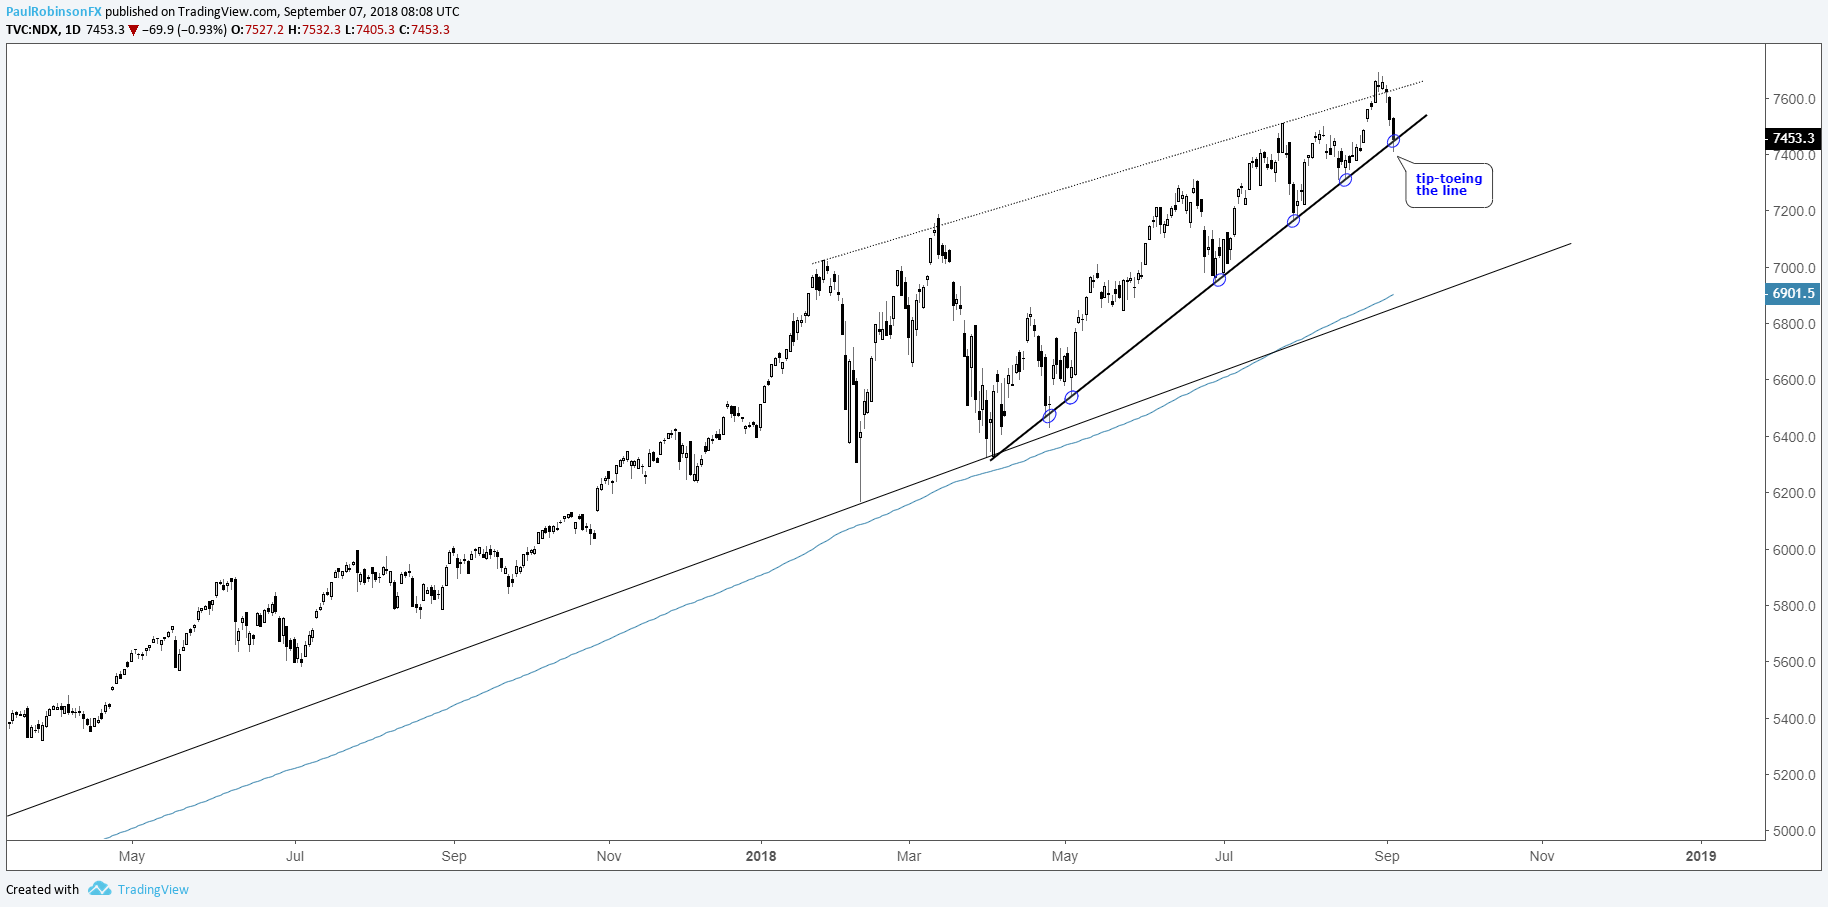
Nasdaq 100 Daily Chart (tip-toeing the line)
Bull market darlings - ‘FAANG’ - showing signs of trouble
The bull market darlings – FAANG (Facebook, Apple, Amazon, Netflix, Google) – make up roughly 40% of the Nasdaq 100, and when you throw in Microsoft you have 6 tickers accounting for about half of the entire index. Top heavy, to say the least.
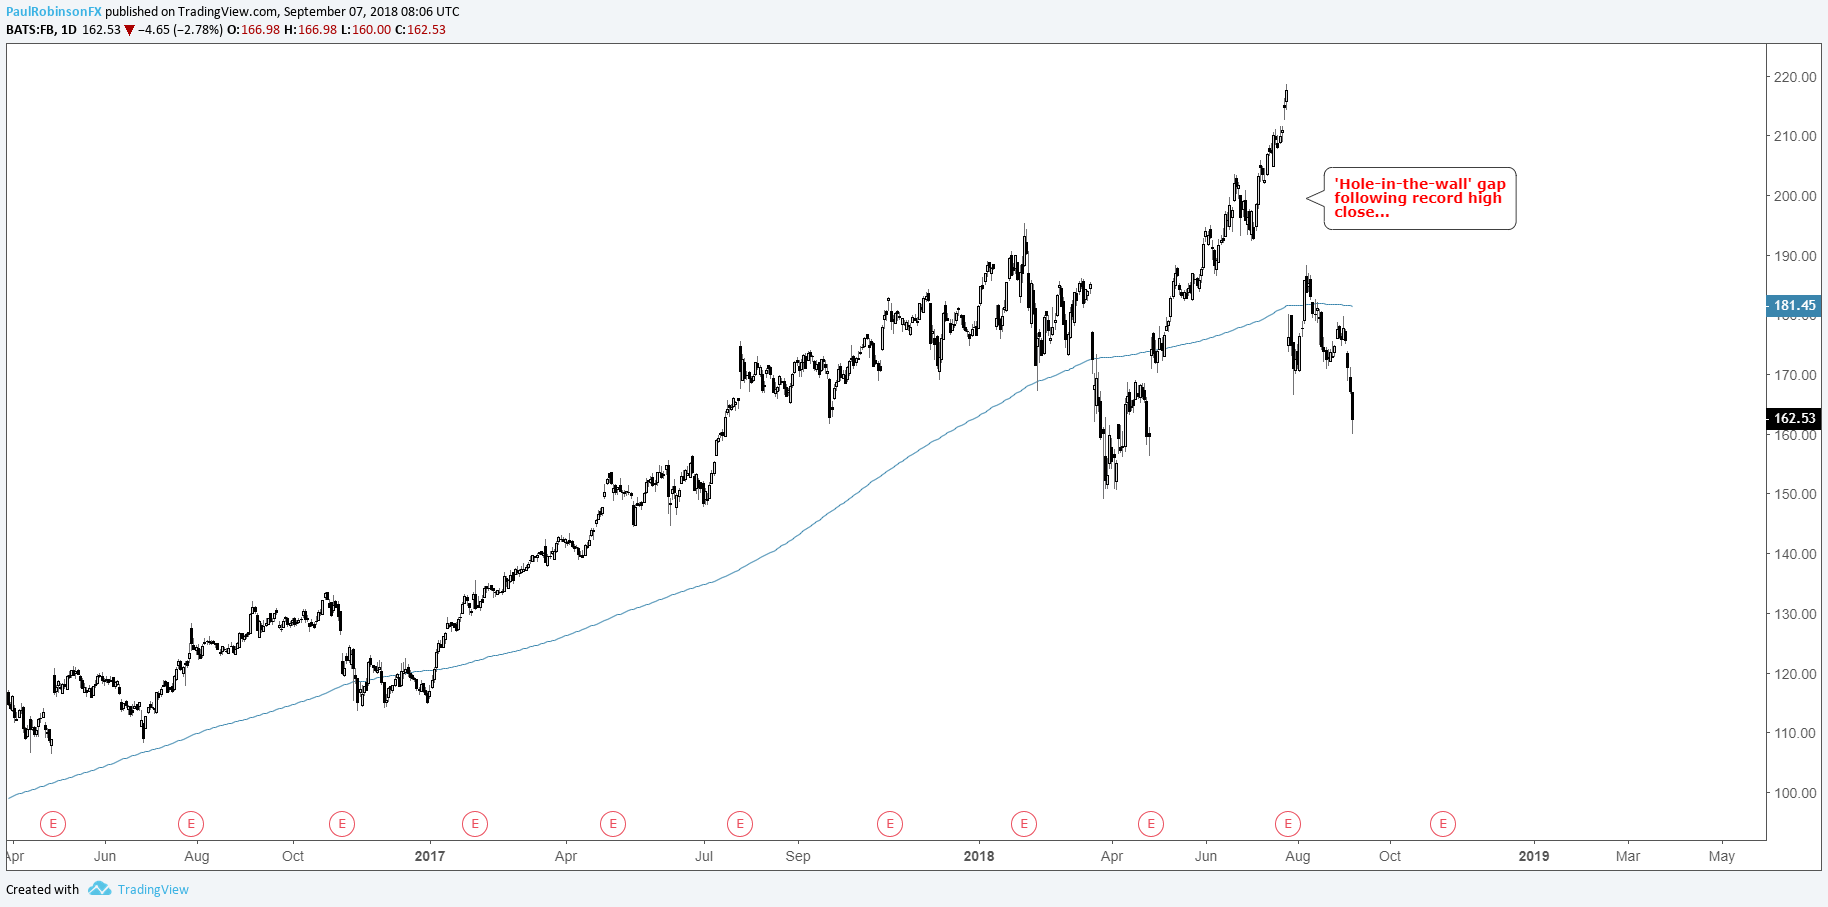
The health of FAANG has recently come into question. Following its last earnings release, Facebook (FB) gapped down 20% after closing to a new record high, creating the rare ‘hole-in-the-wall’ gap. These unusual occurrences often mark a major trend change.
Since earnings, FB made a feeble attempt to fill the gap, but is now breaking lower despite the market just pulling off record highs. Its leadership has been turned on its head, not to mention it seems the world’s attitude towards the social media giant has changed.
Facebook (FB) Daily Chart (‘Hole-in-the-wall’ gap)
Netflix (NFLX) is sitting about 18% off its highs and Alphabet/Google (GOOGL/GOOG) is nearly 10% off the highs. This leaves Apple (AAPL) and Amazon (AMZN) as the only two of the group to participant to record highs.
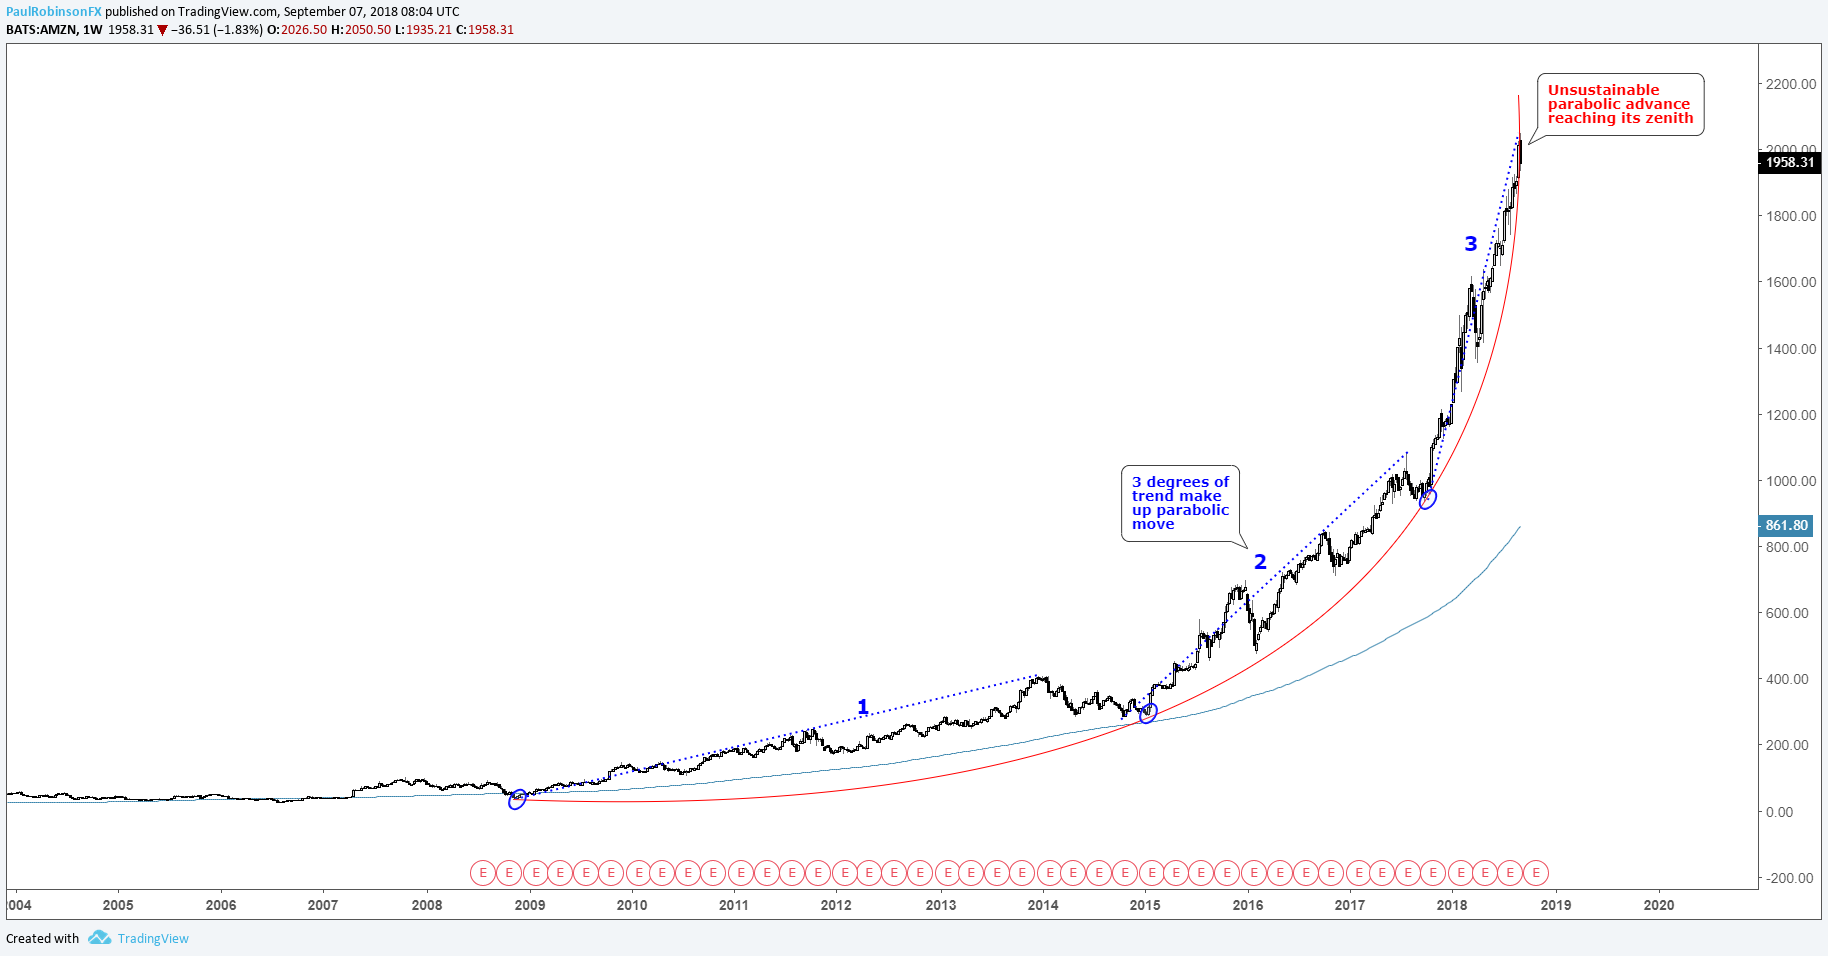
The chart of AMZN is all but bending back to the left, with three degrees of verticality (a splash of Elliot-wave) making up a nearly perfect parabola. An unsustainable trend. A similar case could be made for the entire group, but with AMZN the situation is more glaring. Not that things can’t get a little crazier, but given how parabolic moves work the zenith looks to have either been seen as of this week or very near.
On an anecdotal note, it smacks of excess and psychological 'level' (not a level in the sense of classic technical analysis) that Apple and Amazon have recently crossed the never-seen-before trillion-dollar line in market cap.
Amazon (AMZN) Weekly Chart (Parabolic move unsustainable)
How FAANG goes, NDX goes, rest of the market goes…
Getting back to the rising wedge, with the health of the NDX’s leading group in question, a break of the underside trend-line is seen as a catalyst which could spark a sharp decline (1st target around 15% lower). These patterns forming after long advances are known for leading to swift sell-offs. How goes FAANG goes the Nasdaq 100, and if the rising wedge holds true to its potential then the whole market could very soon be in trouble.
Speaking of trouble, we are already seeing glaring divergence in other major global equity markets compared to the U.S. The DAX is trading at its worst levels since April and quickly coming up on the neckline of a broad head-and-shoulders top, with its beginnings all the way back in June of last year (big downside potential, indeed). The FTSE is currently making good on its own broad topping pattern, also trading at its worst levels since April. In Asia, the Nikkei remains unable to rally and well below its January high.
Indeed, there is fracturing between major global equity markets and the U.S. If the last man standing falls, look for a sizable global stock market rout to ensue. The Nasdaq 100 and its group of market leaders are set up to knock over the final dominos should we soon see the underside of the wedge broken. There is time confluence here, as well, as seasonality is decisively negative for stocks between now heading into October.
We just put together a piece recently highlighting the differences between the three major U.S. indices – ‘Difference Between Dow, Nasdaq, and S&P 500: Major Facts & Opportunities.’. Check it out to learn the varying characteristics one should know if you are going to trade them.
Resources for Forex & CFD Traders
Whether you are a new or experienced trader, we have several resources available to help you; indicator for tracking trader sentiment, quarterly trading forecasts, analytical and educational webinars held daily, trading guides to help you improve trading performance, and one specifically for those who are new to forex.
---Written by Paul Robinson, Market Analyst
You can follow Paul on Twitter at @PaulRobinsonFX


