


Talking Points:
- US stocks have gotten back to their bullish ways after the FOMC-fueled pullback from last week. The S&P 500 is making a fast approach at testing all-time-highs, and the Nasdaq 100 is nearing the same high watermark. The Dow Jones, however, appears a bit more calm and remains below prior swing-highs in February. This highlights the fact that momentum or breakout strategies in US stocks may be better suited elsewhere, while the Dow remains attractive for trend-strategies looking to play pullbacks for bullish continuation.
- This week’s big item on the economic calendar is Friday’s release of US inflation numbers for the month of July.
- DailyFX Forecasts are available from the DailyFX Trading Guides page. If you’re looking to improve your trading approach, check out Traits of Successful Traders. And if you’re looking for an introductory primer to the Forex market, check out our New to FX Guide.
Do you want to see how retail traders are currently trading the US Dollar? Check out our IG Client Sentiment Indicator.
Dow Jones to Fresh Five-Month Highs After FOMC-Fueled Pullback
Bulls have come back into US equities over the past few trading days, helping to reverse a pullback that had started to show as we closed off what had become a very strong month of July. With the Nasdaq 100 poised to soon test all-time-highs, along with the S&P 500 making a strong push towards the same, the Dow Jones Industrial Average appears a bit more calm and has yet to test the February 27th swing high. Given the relative lack of excitement in price action around the Dow Jones Industrial Average, traders would likely want to try to avoid chasing the move here, instead steering breakout and bullish momentum strategies towards the Nasdaq 100 or the S&P.
In the Dow Jones, however, pullbacks can remain attractive for bullish continuation, similar to what we had looked at last Thursday. This observation took place shortly after the FOMC rate decision on Wednesday and the BoE rate decision on Thursday, and prices in the Dow broke down to a short-term support area that helped to establish the low. The area of support that we had identified was taken from the projection of a prior resistance trend-line and, as we advised, this would likely be attractive for those looking to implement aggressive strategies on the index.
Dow Jones Daily Price Chart

Chart prepared by James Stanley
Higher-Low Support Potential in the Dow
With the Dow now trading at fresh five-month highs, the attractive route would be to catch higher-low support for strategies of bullish continuation. Such a zone may exist around the 14.4% Fibonacci retracement of the post-Election run in the Dow, and this is a level that had previously helped to set resistance with swing highs in February, March and then again in June. This area from the June high around 25,405 can be connected down to that Fibonacci level at 25,370 to create a potential higher-low support zone, and this could keep the door open for stops below the 25,290 swing-low.
Dow Jones Four-Hour Price Chart
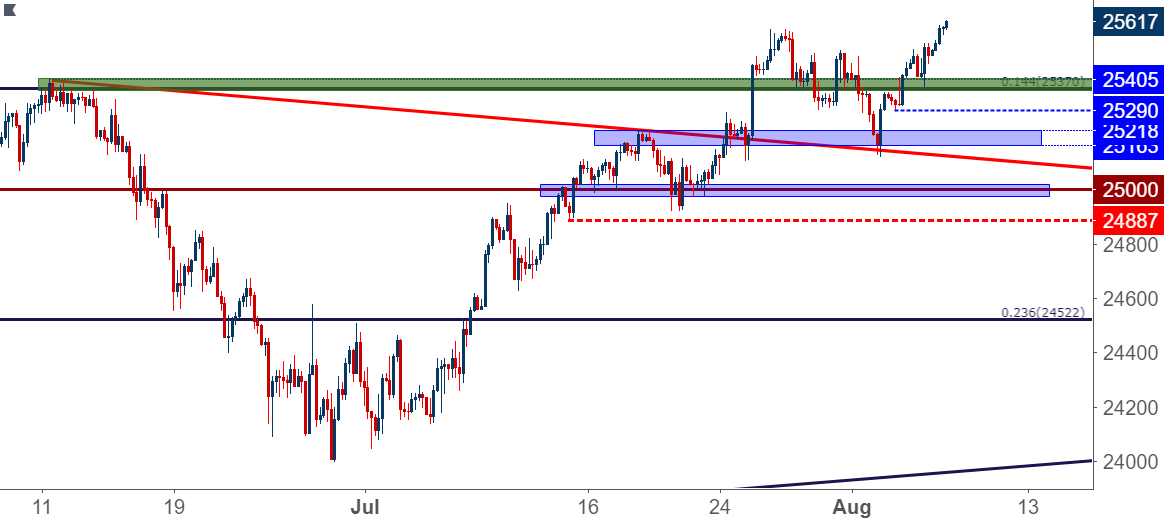
Chart prepared by James Stanley
To read more:
Are you looking for longer-term analysis on the U.S. Dollar? Our DailyFX Forecasts for Q1 have a section for each major currency, and we also offer a plethora of resources on USD-pairs such as EUR/USD, GBP/USD, USD/JPY, AUD/USD. Traders can also stay up with near-term positioning via our IG Client Sentiment Indicator.
Forex Trading Resources
DailyFX offers a plethora of tools, indicators and resources to help traders. For those looking for trading ideas, our IG Client Sentiment shows the positioning of retail traders with actual live trades and positions. Our trading guides bring our DailyFX Quarterly Forecasts and our Top Trading Opportunities; and our real-time news feed has intra-day interactions from the DailyFX team. And if you’re looking for real-time analysis, our DailyFX Webinars offer numerous sessions each week in which you can see how and why we’re looking at what we’re looking at.
If you’re looking for educational information, our New to FX guide is there to help new(er) traders while our Traits of Successful Traders research is built to help sharpen the skill set by focusing on risk and trade management.
--- Written by James Stanley, Strategist for DailyFX.com
Contact and follow James on Twitter: @JStanleyFX


