


Talking Points:
- The Dow Jones Industrial Average has pulled back from the July breakout, and the lower-lows and lower-highs we were looking at on shorter-term charts continues to show. Prices have run into a key area of support, but with NFP on the docket for tomorrow – the big question is whether this support will be able to stem the recent declines.
- The Fed mentioned the word ‘strong’ multiple times in yesterday’s statement, and this alludes to a continued hawkish stance at the Central Bank. Thus far, US Stocks have continued to run-higher despite the Fed being the outlier amongst developed Central Banks in continuing to push hawkish policy. Will the continued strength in the US economy become a hindrance to the topside advance in US stocks? Tomorrow brings Non-Farm Payrolls for a more recent look at the employment picture, and next Friday brings CPI for the month of July for more data on the inflation front.
- DailyFX Forecasts are available from the DailyFX Trading Guides page. If you’re looking to improve your trading approach, check out Traits of Successful Traders. And if you’re looking for an introductory primer to the Forex market, check out our New to FX Guide.
Do you want to see how retail traders are currently trading the US Dollar? Check out our IG Client Sentiment Indicator.
Stocks Drop After No-Change FOMC
US stocks are opening lower on the day, and this comes after weakness showed in futures markets throughout the Asian and European sessions. This is digesting yesterday’s FOMC rate decision, which brought very little by way of new information, but did see the bank note the strength in the US economy multiple times. This appears to keep the Fed on track with their rate hike plans in 2018, and this may even lead to a hawkish Fed next year that produces even more rate hikes. This is helping to pull prices lower across US indices, and the Dow Jones Industrial Average is now testing around the zone of support that we were looking at earlier in the week.
Dow Jones CFD Hourly Chart: Drop After FOMC into Trend-Line Support

Chart prepared by James Stanley
Current support for the Dow appears to be showing around a trend-line projection that can be found by connecting the June swing-high to the July 18th swing high. For those looking at aggressive bullish setups in the index, this can be a usable area to plot for short-term topside reversals.
Dow Jones Four-Hour Price Chart: Support at Prior Resistance Trend-Line
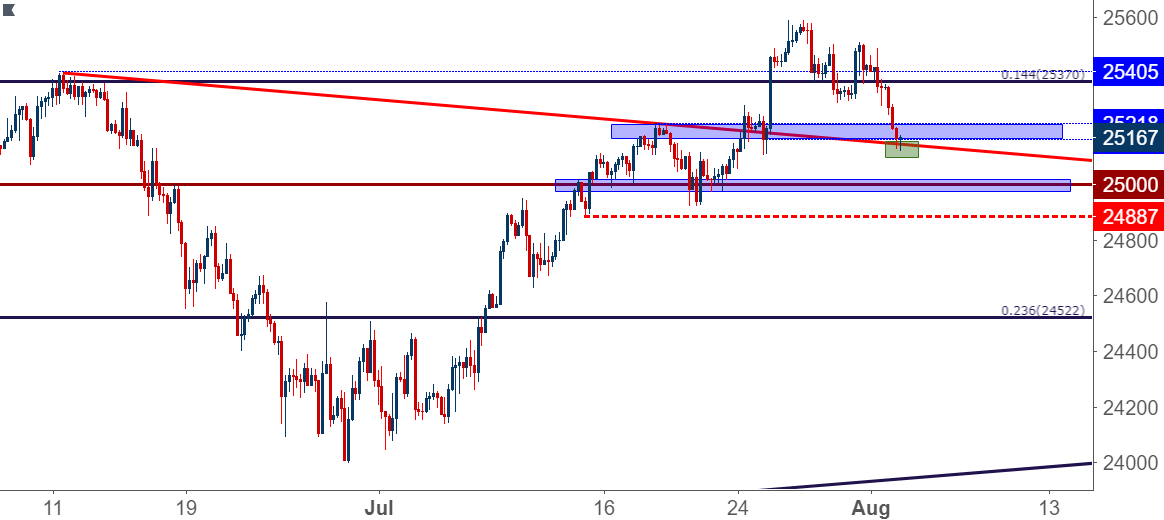
Chart prepared by James Stanley
NFP To Keep Stocks In Play
We’re not yet out of the woods on the data-front for this week, as tomorrow brings the release of July Non-Farm Payrolls out of the United States. As usual, the details of the report will be of importance as market participants look for early clues of continued strength in the US economy, and given the overnight reaction that was seen in US bourses following yesterday’s FOMC rate statement, one could surmise that signs of continued strength above market expectations could drive a deeper pullback in the index.
As we looked at on Tuesday, price action has started to put in lower-lows and lower-highs in the Dow since the bullish breakout that held through most of July. With yesterday/last night’s drop combined with a really big driver on the calendar for tomorrow, traders not utilizing aggressive approaches would likely want to wait for a more confirmed sign of support before looking to take the move-higher. This could also be accomplished by prices getting back into that rhythm of higher-highs and higher-lows, which does not yet exist on the hourly chart of the Dow Jones.
Dow Jones Hourly Price Chart: Support Holds but Lower-Lows, Highs Remain

Chart prepared by James Stanley
To read more:
Are you looking for longer-term analysis on the U.S. Dollar? Our DailyFX Forecasts for Q1 have a section for each major currency, and we also offer a plethora of resources on USD-pairs such as EUR/USD, GBP/USD, USD/JPY, AUD/USD. Traders can also stay up with near-term positioning via our IG Client Sentiment Indicator.
Forex Trading Resources
DailyFX offers a plethora of tools, indicators and resources to help traders. For those looking for trading ideas, our IG Client Sentiment shows the positioning of retail traders with actual live trades and positions. Our trading guides bring our DailyFX Quarterly Forecasts and our Top Trading Opportunities; and our real-time news feed has intra-day interactions from the DailyFX team. And if you’re looking for real-time analysis, our DailyFX Webinars offer numerous sessions each week in which you can see how and why we’re looking at what we’re looking at.
If you’re looking for educational information, our New to FX guide is there to help new(er) traders while our Traits of Successful Traders research is built to help sharpen the skill set by focusing on risk and trade management.
--- Written by James Stanley, Strategist for DailyFX.com
Contact and follow James on Twitter: @JStanleyFX


