


Talking Points:
- The week started off strong for US equities, but that strength could not hold. After trading above the vaulted level of 25,000, the Dow Jones Industrial Average quickly turned-around on Tuesday and into Wednesday. But after support showed around the familiar area of 24,630, prices have continued in a range-like manner.
- Next week is big in the US as we have a loaded economic calendar after the Monday holiday. Given the fact that this data onslaught takes place ahead of the Federal Reserve’s next interest rate decision just a couple of weeks later, and market participants will be looking to read the tea leaves in the effort of seeing just how hawkish the Fed might be in the second half of this year. This has the potential to produce considerable volatility in the equity space.
- DailyFX Forecasts have been updated for Q2, and are available from the DailyFX Trading Guides page. If you’re looking to improve your trading approach, check out Traits of Successful Traders. And if you’re looking for an introductory primer to the Forex market, check out our New to FX Guide.
Do you want to see how retail traders are currently trading the US Dollar? Check out our IG Client Sentiment Indicator.
Dow Jones Fills Gap, Builds Range
The Dow Jones Industrial Average started the week with a bang, gapping-higher and running through the vaulted psychological level of 25,000. But – as we wrote on Tuesday, that gap had not yet filled, and this opened the door for bearish plays. By Wednesday’s US open, the gap was entirely filled and prices in the Dow had run down to a key area of support, around 24,630, and that level has largely helped to hold the lows ever since.
We’ve even seen a bit of follow-thru support and resistance build-in from those prior gap dynamics. The Monday open was around 24,888, and this area has now offered two different resistance inflections since the Tuesday sell-off. The prior Friday close around 24,720 is also relevant, as this area has recently helped to hold a bit of higher-low support.
Dow Jones Hourly Chart: Fills Weekend Gap, Catches Support, then Back-and-Forth
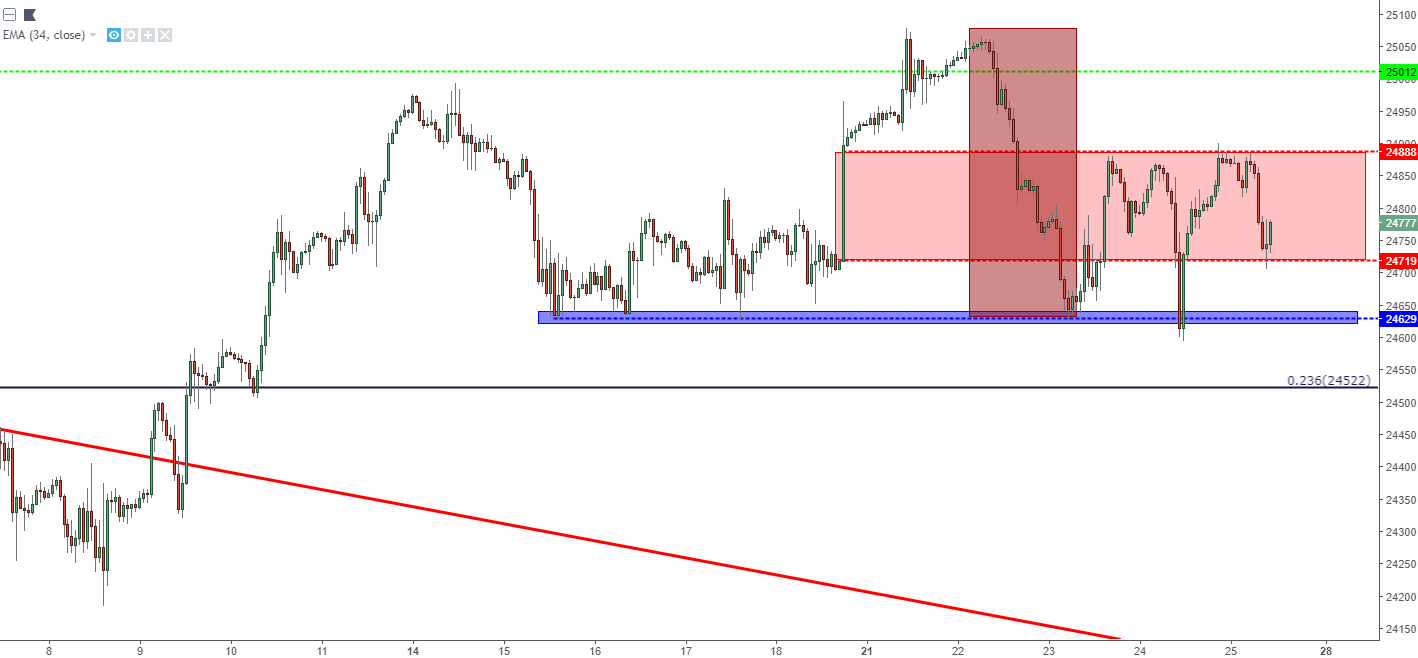
Chart prepared by James Stanley
On an intermediate-term basis, this leaves the index with a rather non-directional feel following the bullish breakout that showed earlier in May. While this week helped to produce a fresh two-month high shortly after that weekend gap, the fact that bulls a) couldn’t continue to drive-higher and b) let a lower-low slip into the chart this week indicates that we may have a deeper pullback before new highs are ready to print. This puts emphasis on the level of 24,500, as this area had previously showed some resistance, and its confluent with the 23.6% Fibonacci retracement of the post-Election move in the Dow Jones Industrial Average.
A visit down to, and support showing around 24,500-24,522 opens the door for bullish setups, with stops just below that zone so that if doesn’t hold, losses could be mitigated.
Dow Jones Four-Hour Chart

Chart prepared by James Stanley
On a longer-term basis, this gives us a box-like formation to work with taken from the back-and-forth price action of the past couple of weeks. A break below that support zone looked at above that runs from 24,500-24,522 opens the door for bearish strategies, targeting re-tests of prior May and April lows of 23,750, 23,550, 23,425 and 23,275. Alternatively, a topside break above the box high around 25,075 opens the door for a deeper move of strength towards prior swings of 25,270 and the 14.4% retracement of the post-Election move at 25,370.
Dow Jones Daily Chart: Box Break to Lead to Directional Cues for Longer-Term Approaches
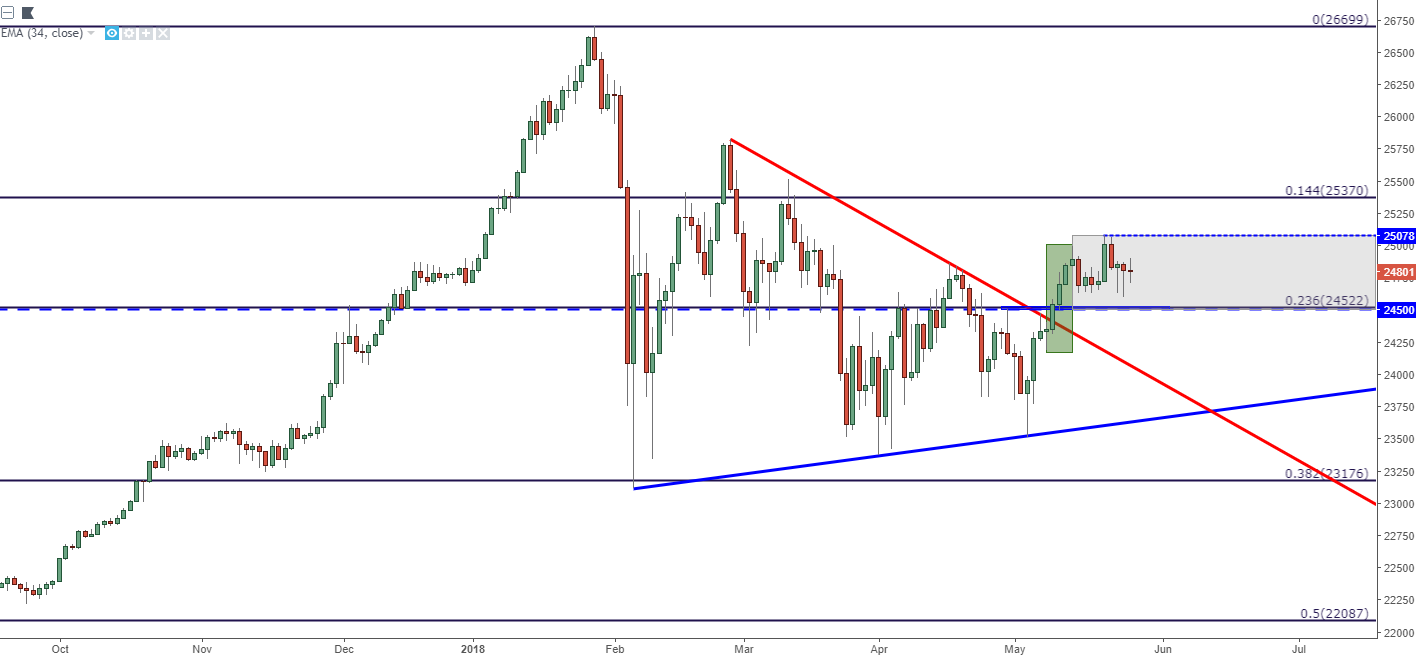
Chart prepared by James Stanley
To read more:
Are you looking for longer-term analysis on the U.S. Dollar? Our DailyFX Forecasts for Q1 have a section for each major currency, and we also offer a plethora of resources on USD-pairs such as EUR/USD, GBP/USD, USD/JPY, AUD/USD. Traders can also stay up with near-term positioning via our IG Client Sentiment Indicator.
Forex Trading Resources
DailyFX offers a plethora of tools, indicators and resources to help traders. For those looking for trading ideas, our IG Client Sentiment shows the positioning of retail traders with actual live trades and positions. Our trading guides bring our DailyFX Quarterly Forecasts and our Top Trading Opportunities; and our real-time news feed has intra-day interactions from the DailyFX team. And if you’re looking for real-time analysis, our DailyFX Webinars offer numerous sessions each week in which you can see how and why we’re looking at what we’re looking at.
If you’re looking for educational information, our New to FX guide is there to help new(er) traders while our Traits of Successful Traders research is built to help sharpen the skill set by focusing on risk and trade management.
--- Written by James Stanley, Strategist for DailyFX.com
Contact and follow James on Twitter: @JStanleyFX


