


Talking Points:
- US Equities stepped back from the proverbial ledge last week, aided in part by a weak NFP report that helped equities to recover after a test of key support.
- In the Dow Jones Industrial Average, a big move in Apple has helped the index to move back towards trend-line resistance, which is part of a bigger-picture descending wedge formation.
- DailyFX Forecasts have been updated for Q2, and are available from the DailyFX Trading Guides page. If you’re looking to improve your trading approach, check out Traits of Successful Traders. And if you’re looking for an introductory primer to the Forex market, check out our New to FX Guide.
Do you want to see how retail traders are currently trading the US Dollar? Check out our IG Client Sentiment Indicator.
US Equities Bounce After Testing Key Support
Last week saw another recurrence of US equity markets stepping back from the proverbial ledge. While the bullish trend that started from the depths of the Global Financial Collapse has yet to reverse, the pickup in volatility in Q1 was noticeable; and for much of the past two-and-a-half months, American stock indices have been wobbling with the prospect of a larger pullback on the horizon.
In the Dow Jones, an area of support has built-in during this congestion, from the area that runs around 23280 up to 23600. The price of 23280 is the 38.2% Fibonacci retracement of the ‘post-Election’ move in the Dow, and this levels remains as pertinent given that we’ve seen buyers continuing to offer support above this area on the chart. This zone first showed as support in early-February, with another iteration in late-March/early-April. At that point, the 200-day moving average started to come into the equation, and since then we’ve seen a couple of different intra-day tests; neither of which has been able to bring a sustained down-side break.
On the resistance side of the coin, we have a descending trend-line taken from the lower-highs that have come-in since that support test in early-February. This produces a descending wedge formation on the Daily chart:
Dow Daily Chart: Hold of Support Zone, 200 DMA
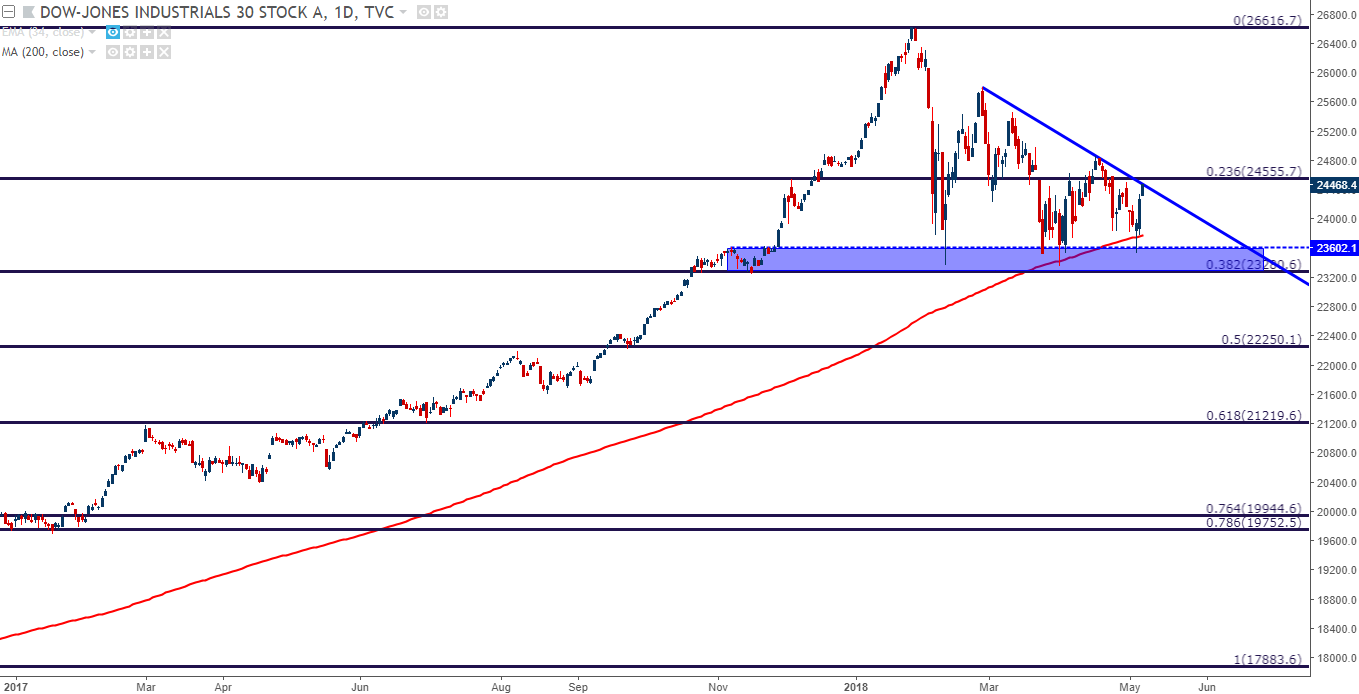
Chart prepared by James Stanley
With prices currently testing trend-line resistance, bulls may want to wait for more confirmation before looking to trade the move-higher. The 23.6% Fibonacci retracement of the post-Election move resides at 24555.7, and a break-above this level would give us a bullish break of the bearish trend-line that’s held the highs over the past couple of months. That can open the door for a re-test of mid-April highs around 24,860, and after that resistance at 24295 is exposed.
Dow Jones Four-Hour Chart

Chart prepared by James Stanley
On the bearish side of the coin, a hold of resistance here opens the door for a re-test of the support zone. The more attractive quality of the short-side scenario would be a break below the February low which could, eventually, bring a bigger move down towards 23250. At this stage, no evidence of that support breaking has shown; but as the old saying goes, ‘up the stairs, down the elevator,’ and this can open the possibility of downside breakouts on the print of fresh lows.
To read more:
Are you looking for longer-term analysis on the U.S. Dollar? Our DailyFX Forecasts for Q1 have a section for each major currency, and we also offer a plethora of resources on USD-pairs such as EUR/USD, GBP/USD, USD/JPY, AUD/USD. Traders can also stay up with near-term positioning via our IG Client Sentiment Indicator.
Forex Trading Resources
DailyFX offers a plethora of tools, indicators and resources to help traders. For those looking for trading ideas, our IG Client Sentiment shows the positioning of retail traders with actual live trades and positions. Our trading guides bring our DailyFX Quarterly Forecasts and our Top Trading Opportunities; and our real-time news feed has intra-day interactions from the DailyFX team. And if you’re looking for real-time analysis, our DailyFX Webinars offer numerous sessions each week in which you can see how and why we’re looking at what we’re looking at.
If you’re looking for educational information, our New to FX guide is there to help new(er) traders while our Traits of Successful Traders research is built to help sharpen the skill set by focusing on risk and trade management.
--- Written by James Stanley, Strategist for DailyFX.com
To receive James Stanley’s analysis directly via email, please SIGN UP HERE
Contact and follow James on Twitter: @JStanleyFX


