


Talking Points:
- The Dow Jones Industrial Average cleared the vaulted 25k psychological level yesterday, helping to produce fresh two-month highs in the index. The big question now is one of continuation potential, as US equities have spent much of the past three months coiling into congestion setups. Are bulls ready to break free to re-test those prior highs?
- US equities gapped-higher to open this week, and to date, many of those gaps remain unfilled. This can make the prospect of short-term reversal setups a bit more attractive in the Dow Jones, at least until some element of higher-low support comes further into view that can help to justify topside exposure.
- DailyFX Forecasts have been updated for Q2, and are available from the DailyFX Trading Guides page. If you’re looking to improve your trading approach, check out Traits of Successful Traders. And if you’re looking for an introductory primer to the Forex market, check out our New to FX Guide.
Do you want to see how retail traders are currently trading the US Dollar? Check out our IG Client Sentiment Indicator.
Dow Breakout Clears 25,000 To Set Fresh Two-Month Highs
The Dow Jones Industrial Average was finally able to push through the vaulted psychological level of 25,000 yesterday, and this comes after a rather pensive few months of price action. While US equities came into the year with the same full head of steam that drove prices for much of the prior 15 months, a pullback started to show in February. This was an approximate 38.2% retracement of that recent bullish trend; but the more disconcerting aspect of that theme was the lack of follow-up bullish response. This helped to produce a series of lower-highs in February, March and April that was quite the change-of-pace since the post-Election run got underway in November of 2016.
Dow Jones Daily Chart: Clear of 25k Resistance Brings Fresh Two-Month Highs

Chart prepared by James Stanley
With prices breaking up to fresh highs, the natural feel here would be to look for a continuation of topside. The challenge with that approach would be the lack of nearby support levels, as the closest swing low is all the way down around 24,600; amounting to approximately 400 points of exposure. Given that we have potential resistance around 320 points-higher on the chart, taken from the 14.4% retracement of the post-Election move, and it can be difficult to justify chasing prices after this recent topside breakout.
Dow Four-Hour Chart: Asymmetric Risk-Reward Makes Prospect of Chasing Sub-Optimal

Chart prepared by James Stanley
On a shorter-term basis, this week’s opening gap has yet to fill-in, and this could be attractive for reversal setups or for those looking to fade this recent breakout. This area can also be used by bulls – looking for some element of higher-low support in this area so that, at the very least, risk can be controlled with stops below 24,600.
Dow Hourly Chart: Remaining Unfilled-Gap From This Week’s Open
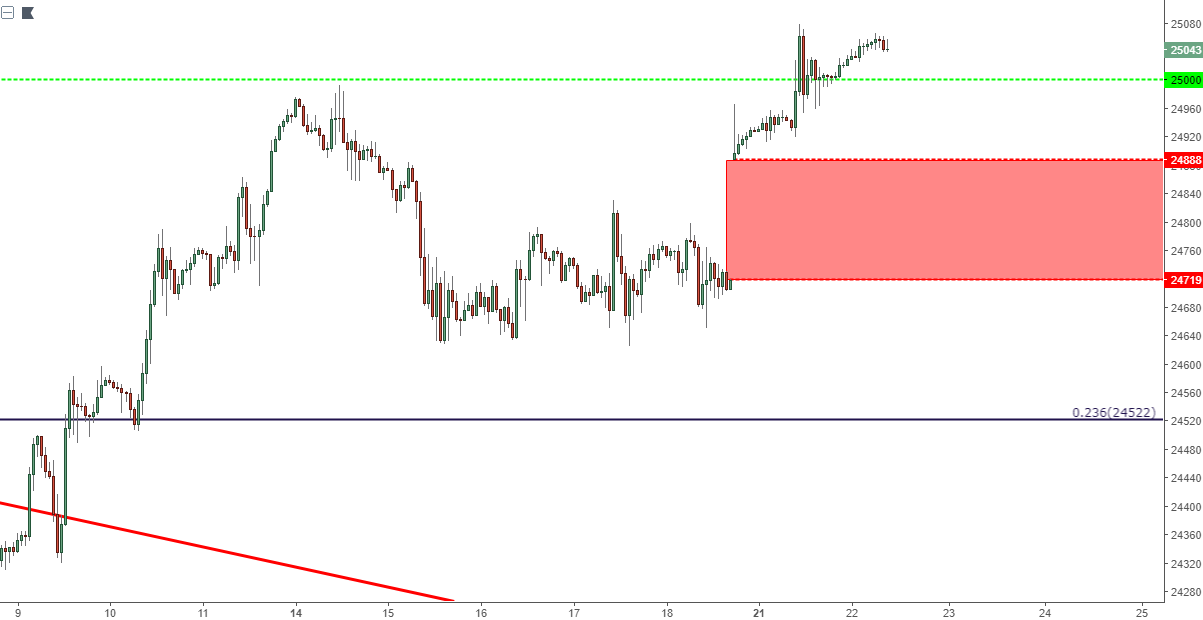
Chart prepared by James Stanley
To read more:
Are you looking for longer-term analysis on the U.S. Dollar? Our DailyFX Forecasts for Q1 have a section for each major currency, and we also offer a plethora of resources on USD-pairs such as EUR/USD, GBP/USD, USD/JPY, AUD/USD. Traders can also stay up with near-term positioning via our IG Client Sentiment Indicator.
Forex Trading Resources
DailyFX offers a plethora of tools, indicators and resources to help traders. For those looking for trading ideas, our IG Client Sentiment shows the positioning of retail traders with actual live trades and positions. Our trading guides bring our DailyFX Quarterly Forecasts and our Top Trading Opportunities; and our real-time news feed has intra-day interactions from the DailyFX team. And if you’re looking for real-time analysis, our DailyFX Webinars offer numerous sessions each week in which you can see how and why we’re looking at what we’re looking at.
If you’re looking for educational information, our New to FX guide is there to help new(er) traders while our Traits of Successful Traders research is built to help sharpen the skill set by focusing on risk and trade management.
--- Written by James Stanley, Strategist for DailyFX.com
Contact and follow James on Twitter: @JStanleyFX


