


- FXCM makes its real trader volume data available to all users
- New DailyFX report uses this volume to help illustrate significance of price levels
- See more information on DailyFX on the Real Volume and Transactions indicators
Visualizing the link between total volumes executed and price helps us identify important price levels. If we see greater buy and/or sell interest at a given level, we can expect that this level may act as important support/resistance. View below for charts of 13 currency pairs and volume data available among the most popular currency pairs on FXCM’s trading platforms.
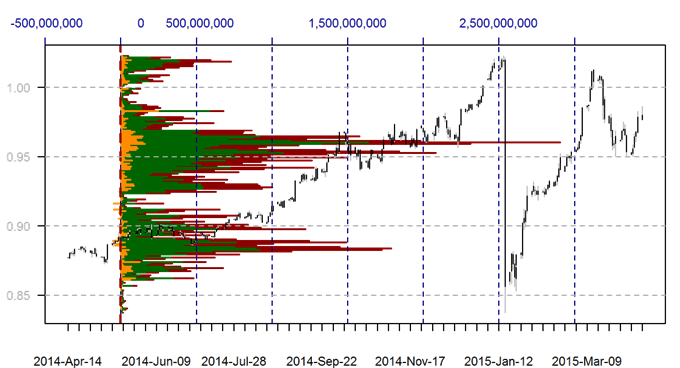
Total Buy Volume Executed, Total Sell Volume Executed, Net Volume Executed (Buy-Sell)
Length of bar indicates the sum of Buy and Sell volume.
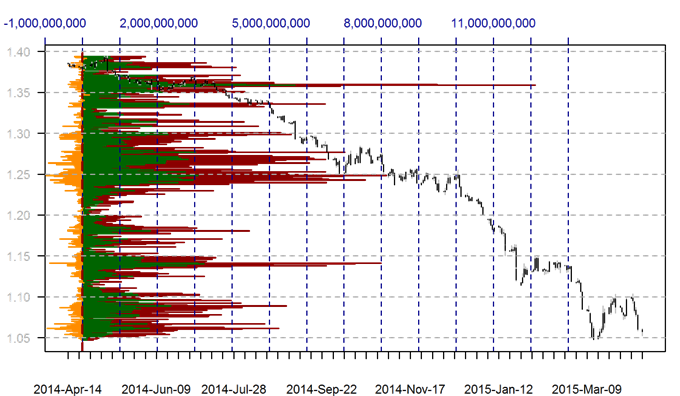
Data source: FXCM Real Directional Volume Indicator, Chart source: R. Prepared by David Rodriguez
Significant volume executed near the $1.0600 figure suggests that the euro trades at important support versus the US Dollar. A break below sees no meaningful support until decade-plus lows at $1.0460, but the lack of volume at that level indicates that such a move would favor a larger breakdown.
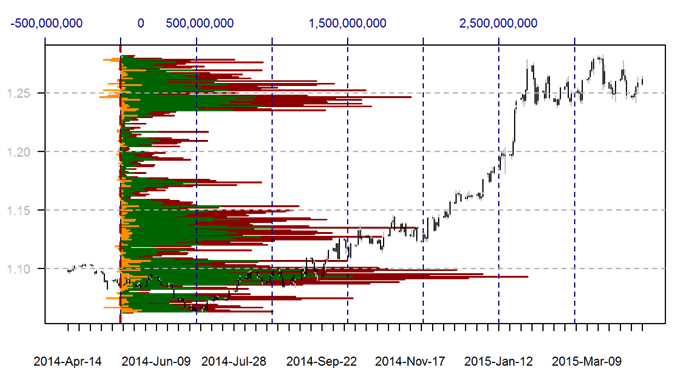
Total Buy Volume Executed, Total Sell Volume Executed, Net Volume Executed (Buy-Sell)
Length of bar indicates the sum of Buy and Sell volume.
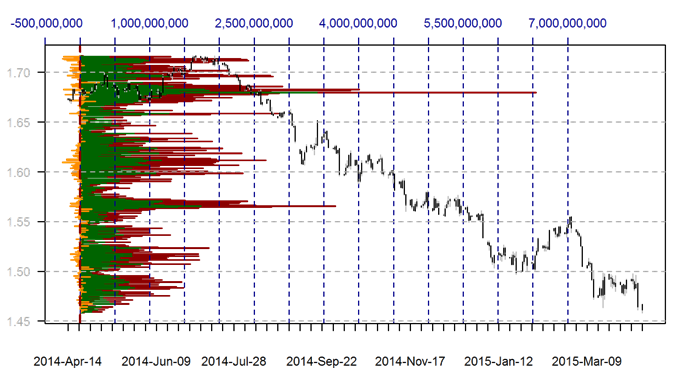
Data source: FXCM Real Directional Volume Indicator, Chart source: R. Prepared by David Rodriguez
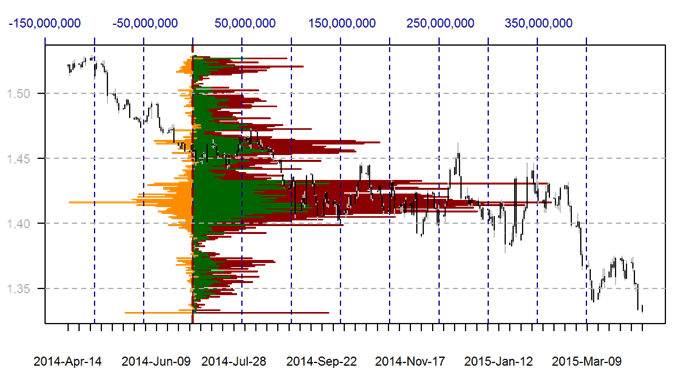
The British Pound trades near significant lows with no meaningful volume patterns pointing to important support. Risks remain to the downside.
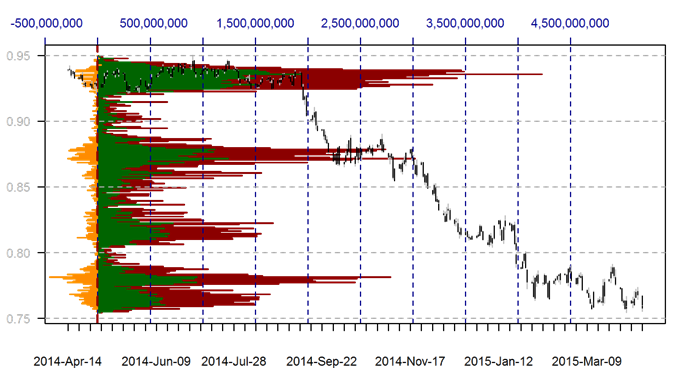
Total Buy Volume Executed, Total Sell Volume Executed, Net Volume Executed (Buy-Sell)
Length of bar indicates the sum of Buy and Sell volume.
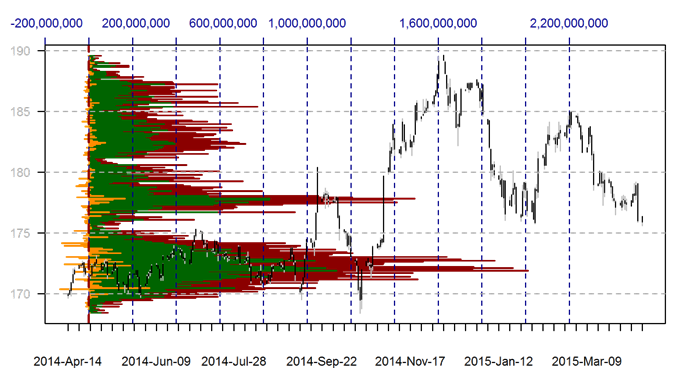
Data source: FXCM Real Directional Volume Indicator, Chart source: R. Prepared by David Rodriguez
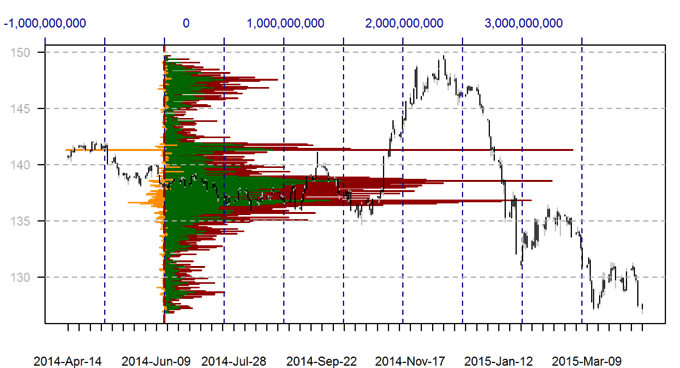
The British Pound trades near important resistance and congestion near ¥177 and sees no meaningful support until ¥173.
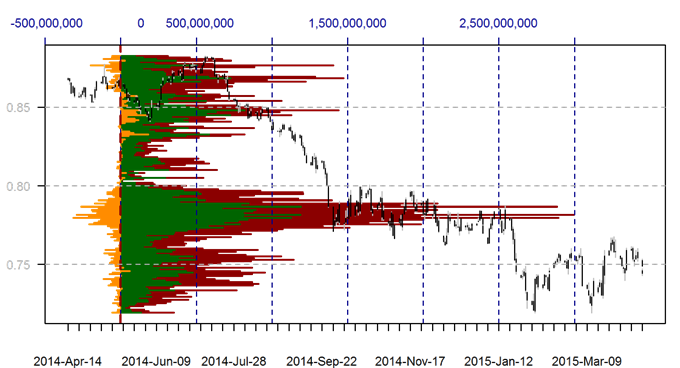
Total Buy Volume Executed, Total Sell Volume Executed, Net Volume Executed (Buy-Sell)
Length of bar indicates the sum of Buy and Sell volume.
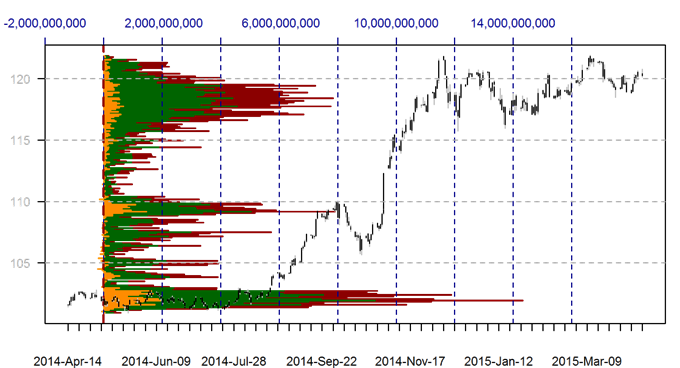
Data source: FXCM Real Directional Volume Indicator, Chart source: R. Prepared by David Rodriguez
Traders have kept the US Dollar in a range versus the Japanese Yen. The lack of significant trader volume suggests there is little in the way of a break to fresh highs, while support is significant in the ¥118-120 zone.
Total Buy Volume Executed, Total Sell Volume Executed, Net Volume Executed (Buy-Sell)
Length of bar indicates the sum of Buy and Sell volume.
Data source: FXCM Real Directional Volume Indicator, Chart source: R. Prepared by David Rodriguez
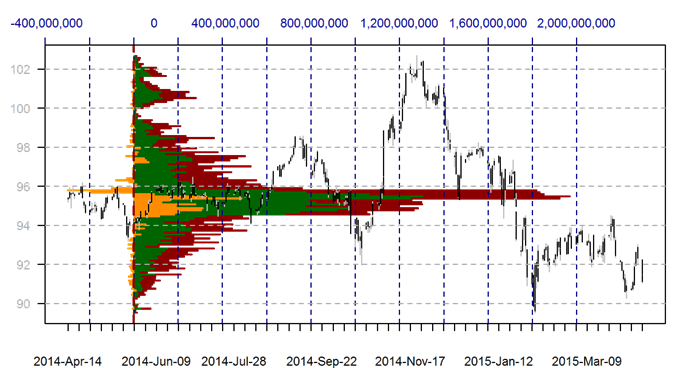
The US Dollar trades above key support versus the Swiss Franc. Important resistance is seen near the SFr1.01 mark.
Total Buy Volume Executed, Total Sell Volume Executed, Net Volume Executed (Buy-Sell)
Length of bar indicates the sum of Buy and Sell volume.
Data source: FXCM Real Directional Volume Indicator, Chart source: R. Prepared by David Rodriguez
The Canadian Dollar remains in a tight range versus the US Dollar. Key USDCAD support is seen at C$1.25, while resistance seems relatively limited below C$1.2800.
Total Buy Volume Executed, Total Sell Volume Executed, Net Volume Executed (Buy-Sell)
Length of bar indicates the sum of Buy and Sell volume.
Data source: FXCM Real Directional Volume Indicator, Chart source: R. Prepared by David Rodriguez
Modest volume on the Australian Dollar points to limited support below current prices. Important resistance is seen near the $0.7700 mark.
Total Buy Volume Executed, Total Sell Volume Executed, Net Volume Executed (Buy-Sell)
Length of bar indicates the sum of Buy and Sell volume.
Data source: FXCM Real Directional Volume Indicator, Chart source: R. Prepared by David Rodriguez
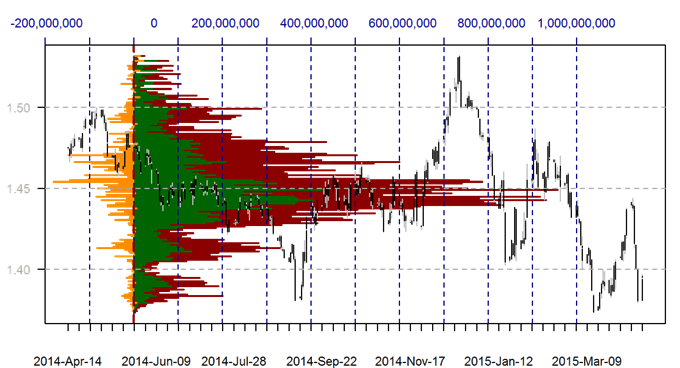
New Zealand Dollar volume has been fairly significant near $0.7500. Near-term support is seen at approximately $0.7400 with relatively little in the way of a larger decline.
Total Buy Volume Executed, Total Sell Volume Executed, Net Volume Executed (Buy-Sell)
Length of bar indicates the sum of Buy and Sell volume.
Data source: FXCM Real Directional Volume Indicator, Chart source: R. Prepared by David Rodriguez
Limited EUR/JPY volume at current levels offers little meaningful support. A noteworthy spike in volume near ¥129 offers near-term resistance.
Total Buy Volume Executed, Total Sell Volume Executed, Net Volume Executed (Buy-Sell)
Length of bar indicates the sum of Buy and Sell volume.
Data source: FXCM Real Directional Volume Indicator, Chart source: R. Prepared by David Rodriguez
Modest AUD/JPY volume at current levels suggests there is little in the way of a larger breakdown. Significant resistance is seen near the ¥95 mark.
Total Buy Volume Executed, Total Sell Volume Executed, Net Volume Executed (Buy-Sell)
Length of bar indicates the sum of Buy and Sell volume.
Data source: FXCM Real Directional Volume Indicator, Chart source: R. Prepared by David Rodriguez
A meaningful spike in EUR/AUD volume at recent lows of A$1.3800 highlights this level as support, while resistance is seen at congestion levels of $A1.4100.
Total Buy Volume Executed, Total Sell Volume Executed, Net Volume Executed (Buy-Sell)
Length of bar indicates the sum of Buy and Sell volume.
Data source: FXCM Real Directional Volume Indicator, Chart source: R. Prepared by David Rodriguez
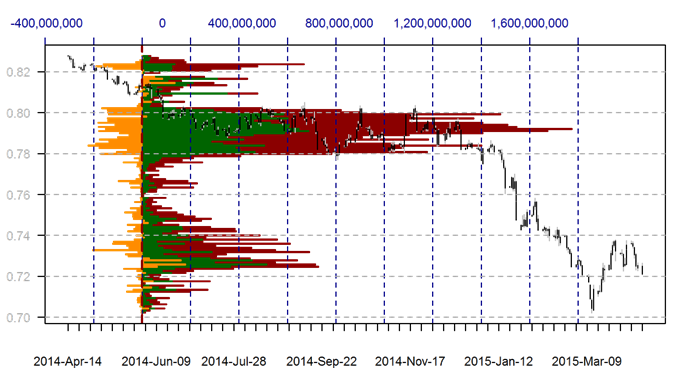
The Euro/Sterling trades at potentially meaningful support as indicated by volume near 0.7250. A break lower shows little in the way of important price floors, while resistance extends through 0.7350.
Total Buy Volume Executed, Total Sell Volume Executed, Net Volume Executed (Buy-Sell)
Length of bar indicates the sum of Buy and Sell volume.
Data source: FXCM Real Directional Volume Indicator, Chart source: R. Prepared by David Rodriguez
A meaningful spike in EUR/CAD volume near current levels suggests significant selling interest may be enough to drive the pair to fresh lows. Resistance is seen in the C$1.3600 area.
--- Written by David Rodriguez, Quantitative Strategist for DailyFX.com
Contact David via
Twitter at http://www.twitter.com/DRodriguezFX


