


Canadian Dollar, USDCAD and EURCAD Talking Points:
- Technical Outlook: Neutral.
- USDCAD Gains Traction Hitting a 22-Month High with Technical Hurdles Ahead.
- EURCAD Breaks Out of Two-Month-Old Range and Gains Momentum.
CAD and Oil: The Canadian Dollar and Oil Price Correlation
Canadian Dollar Outlook
The Bank of Canada (BOC) last week delivered its fourth outsized rate hike since March, with a further 75bp following July’s 100bp hike. According to the BOC, a further softening in household demand is required to bring inflation under its target rate. The effort to frontload rate hikes did see the CAD enjoy some strength. Since then, we have seen the resumption of CAD weakness across the board with both USD and the Euro gaining. Given the FOMC meeting next week there is a strong possibility for a bit of respite for the Canadian Dollar should the Fed outlook be less hawkish than expected.Given the shifting sentiment and particularly with the FOMC ahead it is not wise to be married to any long-term bias at this stage.
Introduction to Technical Analysis
Learn Technical Analysis
Recommended by Zain Vawda
TECHNICAL OUTLOOK
USDCAD Daily Chart
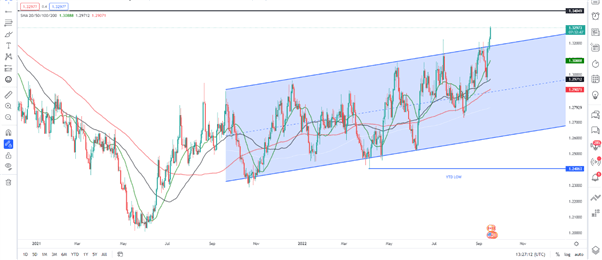
Source: TradingView, prepared by Zain Vawda
From a technical perspective, USDCAD has been on a steady upward move since its YTD low around the 5th April (see chart). We have also broken out of an ascending channel we have been trading within since September 2021 as the dollar index continues its advance. Last week’s candle close gave sellers of the pair hope as we closed as a bearish engulfing candle before bouncing off the 50-SMA, taking out the highs this week and pushing on.
On a daily timeframe, price action may indicate further upside as we have been creating higher highs and higher lows since the August 11 low of around 1.27300. We have a significant area of resistance a further 100 pips away, resting around the 134.000 level. The RSI is currently in overbought territory which could mean we are due a pullback soon, supporting this is the fact that we have just made a new high. The MA’s are currently well below the current price while the gradient slope indicates strong bullish momentum. There is a strong chance we see higher prices heading into the FOMC meeting next week which could provide a catalyst for the pair, either to push on with a more hawkish Fed or some respite for the CAD on a more bearish outlook.
| Change in | Longs | Shorts | OI |
| Daily | -2% | 7% | 5% |
| Weekly | -30% | 38% | 13% |
EURCAD Daily Chart
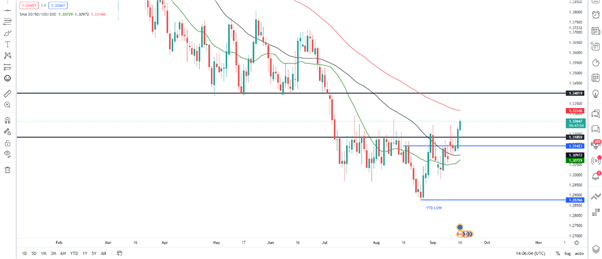
Source: TradingView, prepared by Zain Vawda
From a technical perspective, EURCAD has been on a steady decline since the year began before bottoming out at around the 1.28760 area. We have since had a significant upside rally of around 380-odd pips with August’s monthly candle closing as a hammer candlestick. On the weekly timeframe, we are on course for our third straight week of gains even if the previous two were unconvincing, the current week seems set to close as a hammer candlestick as well as closing above the key 1.32000 area.
The daily timeframe provides an indication of price action at work, as we have steadily moved higher creating higher highs and higher lows. The moving averages have provided support as we have stair cased higher with the price currently above the 20 and 50-SMA. The gradients of these two MA’s are now pointing to the upside with signs they are looking to crossover as well. The 100-SMA rests about 40 pips above the current price which should provide some resistance and could see us pullback slightly to the preferred support area at 1.32000 while a deeper pullback to the 20 and 50-SMA cannot be ruled out. Any pullback may provide would-be-longs a better risk-to-reward opportunity as a significant resistance level rests at the 1.34000 area.
Introduction to Technical Analysis
Technical Analysis Chart Patterns
Recommended by Zain Vawda
Resources For Traders
Whether you are a new or experienced trader, we have several resources available to help you; indicators for tracking trader sentiment, quarterly trading forecasts, analytical and educational webinars held daily, trading guides to help you improve trading performance, and one specifically for those who are new to forex.
--- Written by Zain Vawda for DailyFX.com
Contact and follow Zain on Twitter: @zvawda


