


US Dollar Technical Forecast: Bullish
- The US Dollar set a fresh 20-year-high this week, and then pulled back the day after the FOMC rate decision, falling by more than 2% after the Fed’s largest hike in 28 years.
- The USD came back to life on Friday, helped along by another dovish BoJ rate decision. After the ECB meeting in the prior week, this keeps the USD as somewhat of an outlier with a central bank actively pushing for much higher rates and tighter monetary policy. And that can keep the trend moving higher until something shifts there.
- The analysis contained in article relies on price action and chart formations. To learn more about price action or chart patterns, check out our DailyFX Education section.

The US Dollar just completed a very busy week. The prior week closed with doom and gloom as the risk trade tightened up ahead of the FOMC’s anticipated tightening. And then on Monday, the rumor began to spread that the Federal Reserve was now contemplating a 75 basis point hike as opposed to the 50 basis point move that they had prepared everyone for. That helped to prod the USD higher, eventually setting a fresh 20-year high on Tuesday which was eclipsed with another fresh 20-year high on Wednesday, just after the FOMC released the statement formally announcing the move.
What happened after that, however, caught many by surprise. On Thursday, the day after the FOMC hike announcement, the currency fell by more than 2%. I fielded a number of questions over Twitter wondering why or how this could happen. The answer isn’t perfectly clear cut but the following morning saw a rate hike out of the Swiss National Bank to the tune of 50 basis points which caught many by surprise, and this was followed by the Bank of England warning that inflation could run as high as 11% in their economy later this year.
Thursday ended up being a fast reversion day as pullbacks showed in all of EUR/USD, GBP/USD and USD/JPY. But, a bit of news was delivered on Thursday night (Friday morning in Asia) that got USD bulls back on the bid. The Bank of Japan kept policy steady while avoiding any proclamations of defending the currency. The Yen was beset by a significant stream of weakness coming into this week and the USD/JPY pair pulled back aggressively ahead of that meeting. I’ll discuss this theme more in the USD/JPY section as this may have some workable context for the coming week.
US Dollar
I want to start with the monthly chart here because frankly we’re in the midst of some historic movements in the USD. There’s also some relevance from a Fibonacci retracement produced by the 2001-2008 major move, with the 61.8% Fibonacci retracement coming into play as support in both May and June. Last month saw the pullback with support settling around that spot, and June opened with bulls making another move to create a bounce from that support.
Prices holding above this level keeps the door open for bullish continuation.
US Dollar Monthly Price Chart
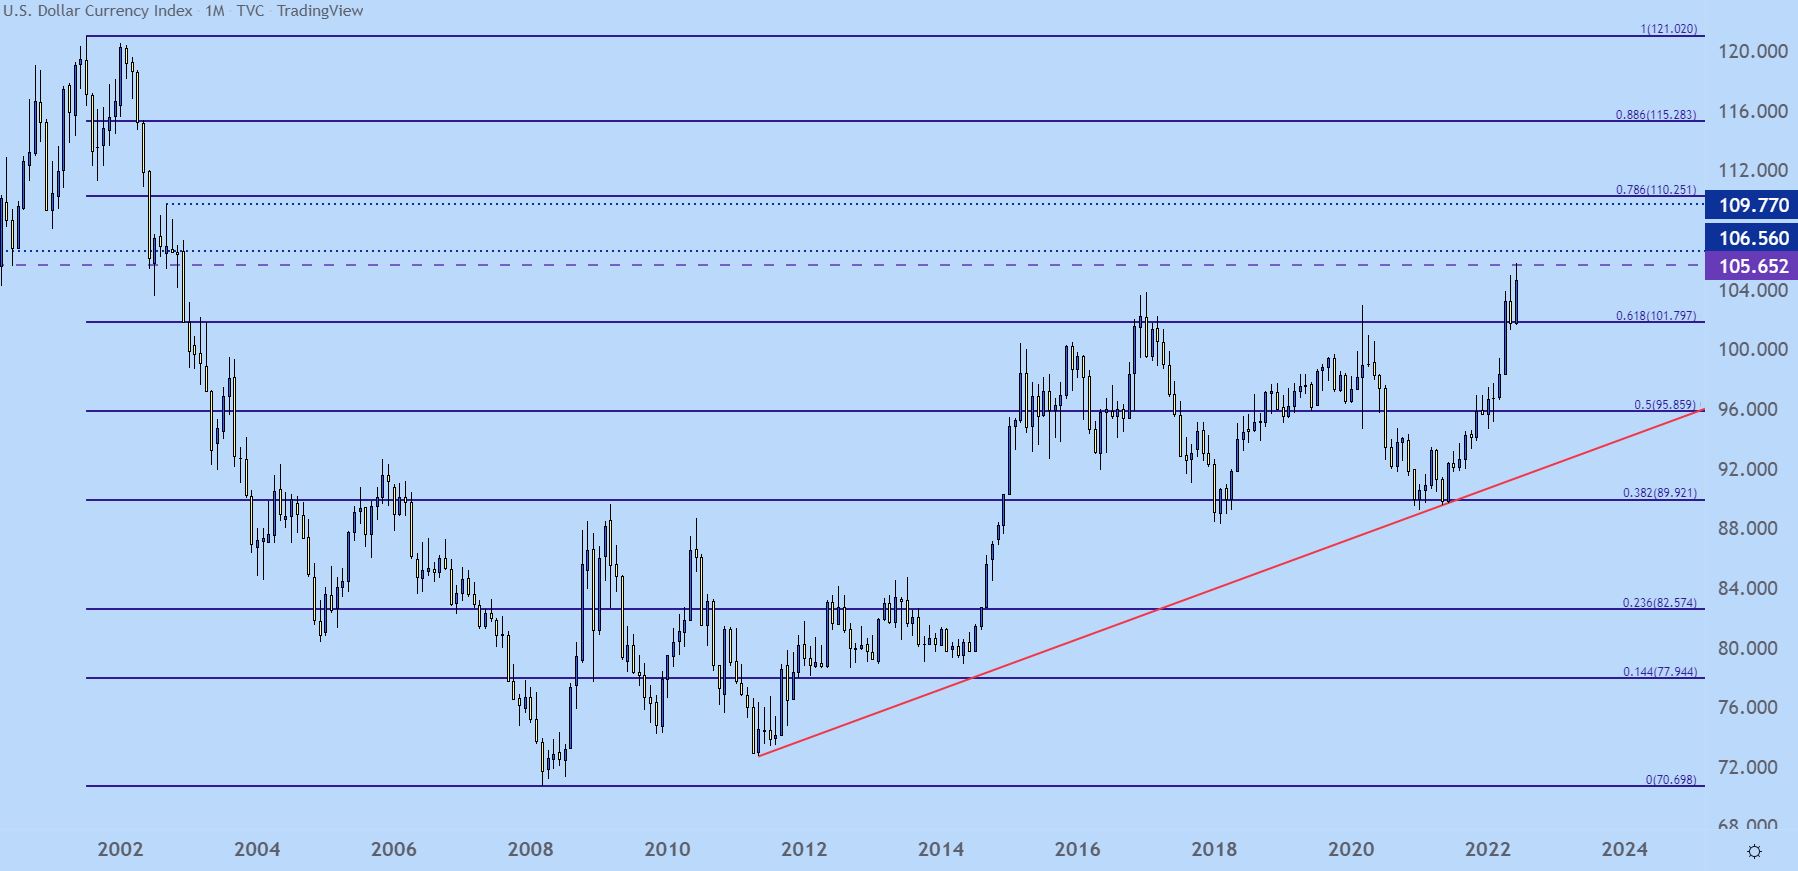
Chart prepared by James Stanley; USD, DXY on Tradingview
Shorter-term, the trend is less certain given the recent pullback. From a fundamental vantage point, the possibility of greater strength does exist, largely taken from the deviation discussed earlier. But, technically speaking, we have just one day of strength after that aggressive pullback developed post-Fed. And the culprit of that pullback will likely remain a theme of note in the coming week and there’s a large focus on the ECB and the European Central Bank for possible hints of greater hawkishness there, which I’ll discuss a bit lower in the EUR/USD section.
In USD, breakout strategies remain attractive on prints of fresh highs. The next logical resistance on the chart would be around the 106.00 level, after which a prior swing from 2002 comes into the picture around 106.56.
For support – the area around 102.65 seems relevant, as this had helped to set short-term resistance in an ascending triangle formation in the prior week which started to give way after the ECB rate decision. And, of course, below that we have the Fibonacci level from the longer-term chart plotted at 101.80.
US Dollar Daily Chart
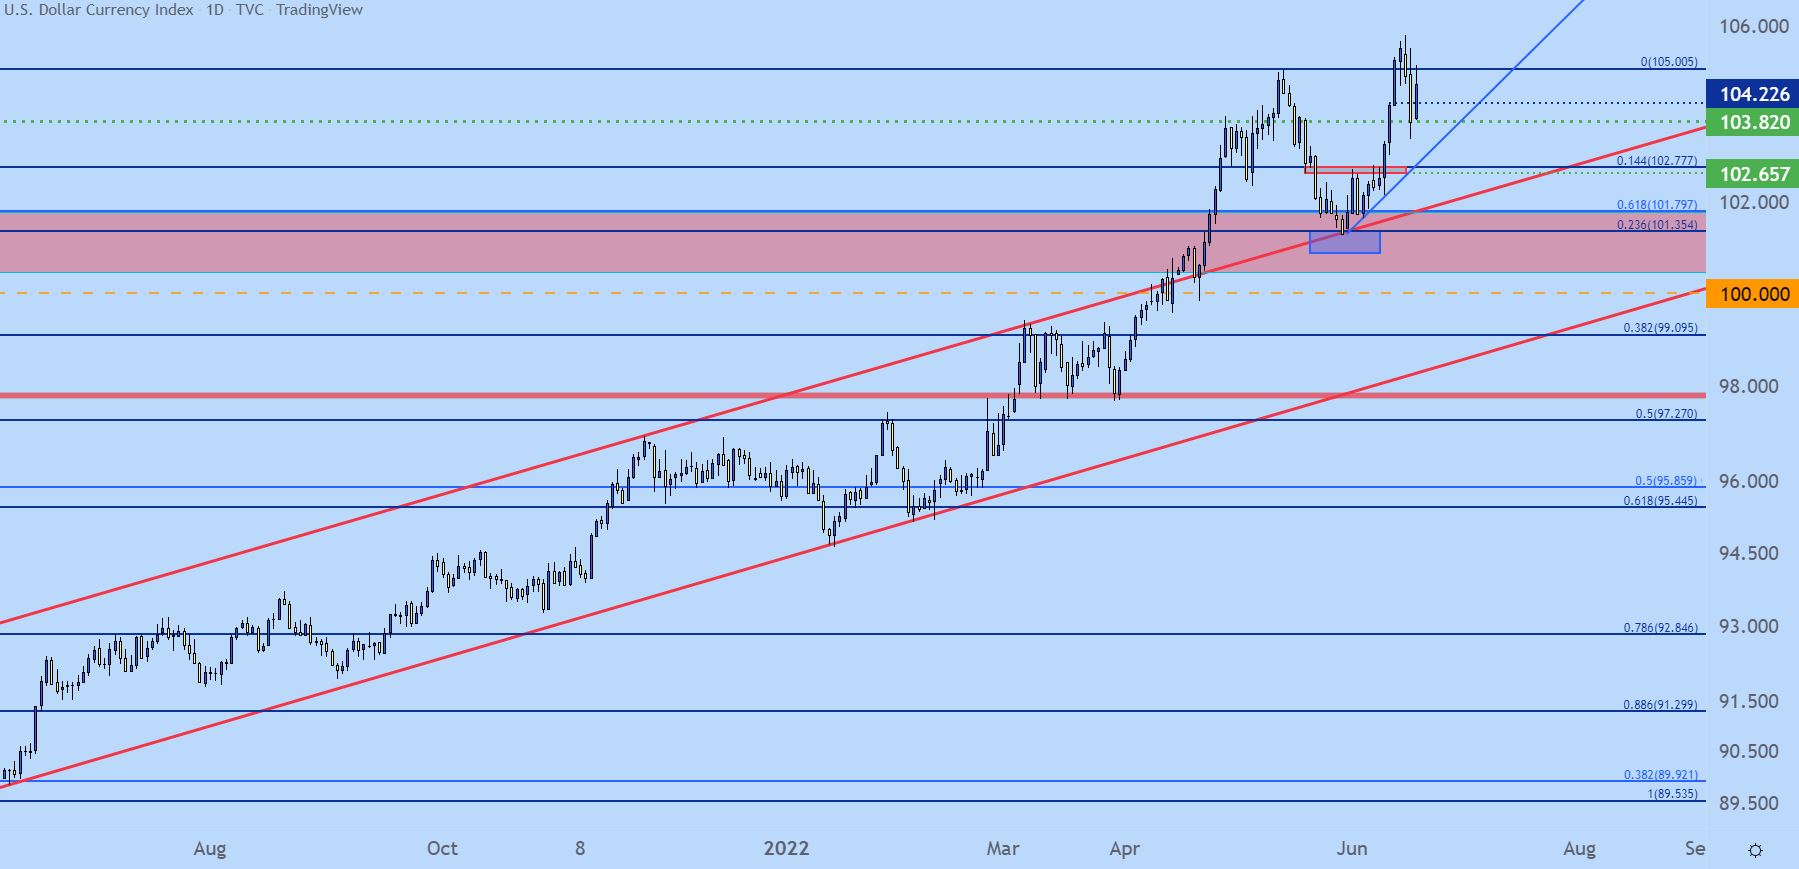
Chart prepared by James Stanley; USD, DXY on Tradingview
EUR/USD
It was less than a week after the ECB rate decision that the bank huddled together for an emergency meeting. This isn’t usually a good sign and, if anything, its acknowledgement that the banks messaging could’ve done a better job around the rate decision.
That messaging was extremely dovish, all factors considered. European inflation is above 8% and, like the Fed, the central bank is very much behind the curve. But, while the Fed is hurriedly trying to play catch up the ECB is still reticent to tighten given the ongoing war on the Eastern border and this presents some considerable risk moving forward. Nonetheless, at the last rate decision the ECB talked about a 25 basis point hike in July which doesn’t seem like it will get the job done.
But, due to that dovishness, the bottom quickly fell out of EUR/USD after that meeting and the bearish theme lasted for much of last week. But – at this point the pair still has yet to test through the 20-year low that rests at 1.0340. EUR/USD had come close to breaking through in May and then again around the FOMC statement. But, if the ECB fails to make any announcements pertaining to more-hawkish policy, either through statements or through leaks, which is not unheard of, then we may be seeing that fresh low in the pair before too long.
For near-term resistance in the pair, the same 1.0593-1.0638 area remains. This is the spot that caught the weekly high after the USD pullback and until that’s broken through, EUR/USD continues with bearish scope.

EUR/USD Four-Hour Price Chart
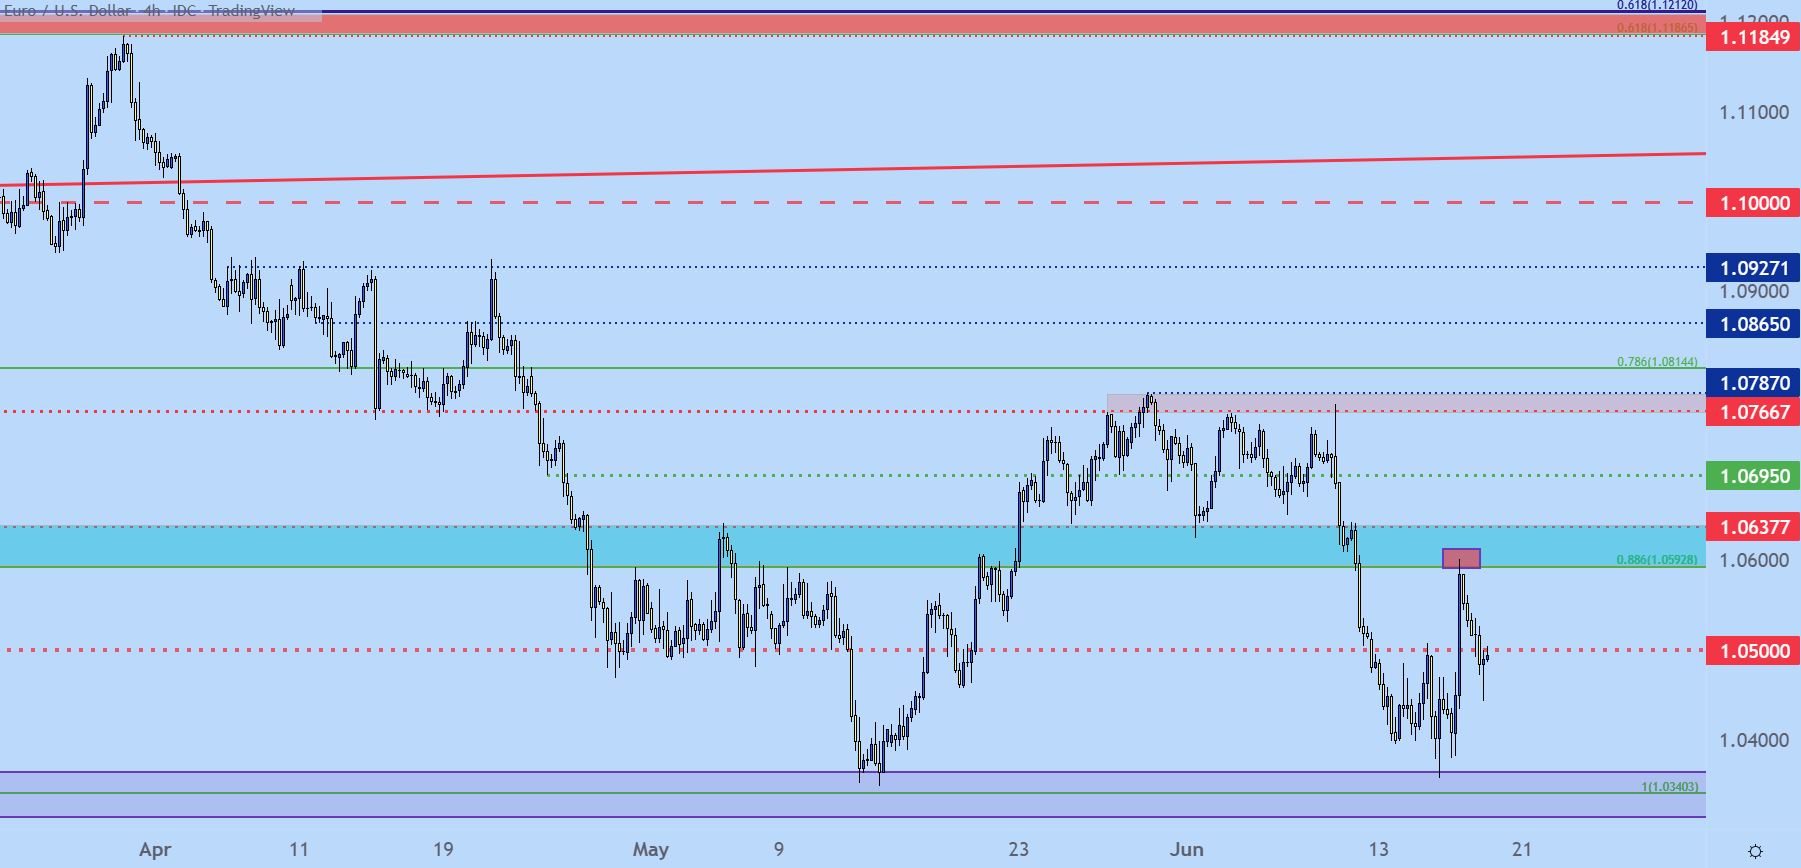
Chart prepared by James Stanley; EURUSD on Tradingview
GBP/USD
The Bank of England hiked rates by 25 basis points last week. But, much had already taken place before we got to that.
The week started with breakdown in the pair as GBP/USD pushed below the 1.2000 psychological level for the first time in over two years. That led to a pullback which really strengthened on Thursday, when the USD was pulling back. This allowed GBP/USD to run all the way up to 1.2480 before starting to pullback again.
On Friday, some short-term support started to play-in around prior short-term resistance; and this could support a continued topside move up to the prior support zone running from 1.2452-1.2500. At that point, shorts may become attractive again but this would be situation-dependent.
GBP/USD Eight-Hour Price Chart
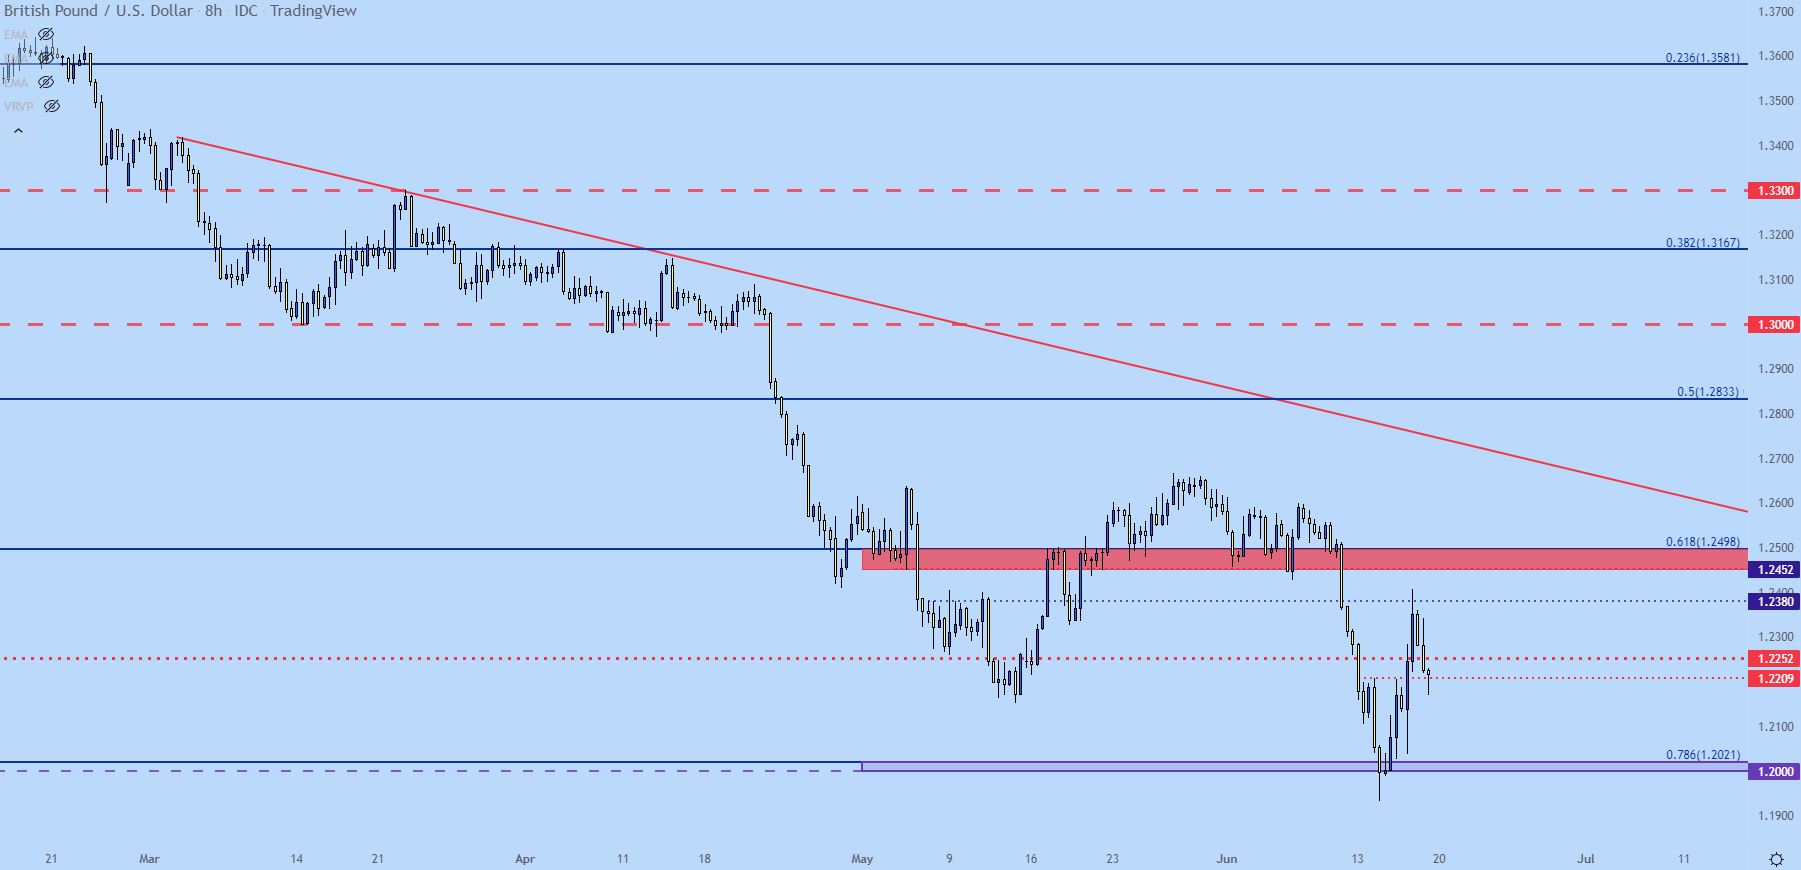
Chart prepared by James Stanley; GBPUSD on Tradingview
AUD/USD
The longer-term AUD/USD chart remains in a bull flag formation and this week saw some defense around a higher-low from the May inflection. While this is far from a bullish picture, it does open up the possibility for a bounce if we see some continued defense of this spot on the chart. This spans from around .6825 up to .6850 and a hold here keeps the door open for bounce potential. If it breaches, however, the next support level down is around the .6750 psychological level, which is confluent with the 50% mark of the 2020-2021 major move.

AUD/USD Weekly Price Chart
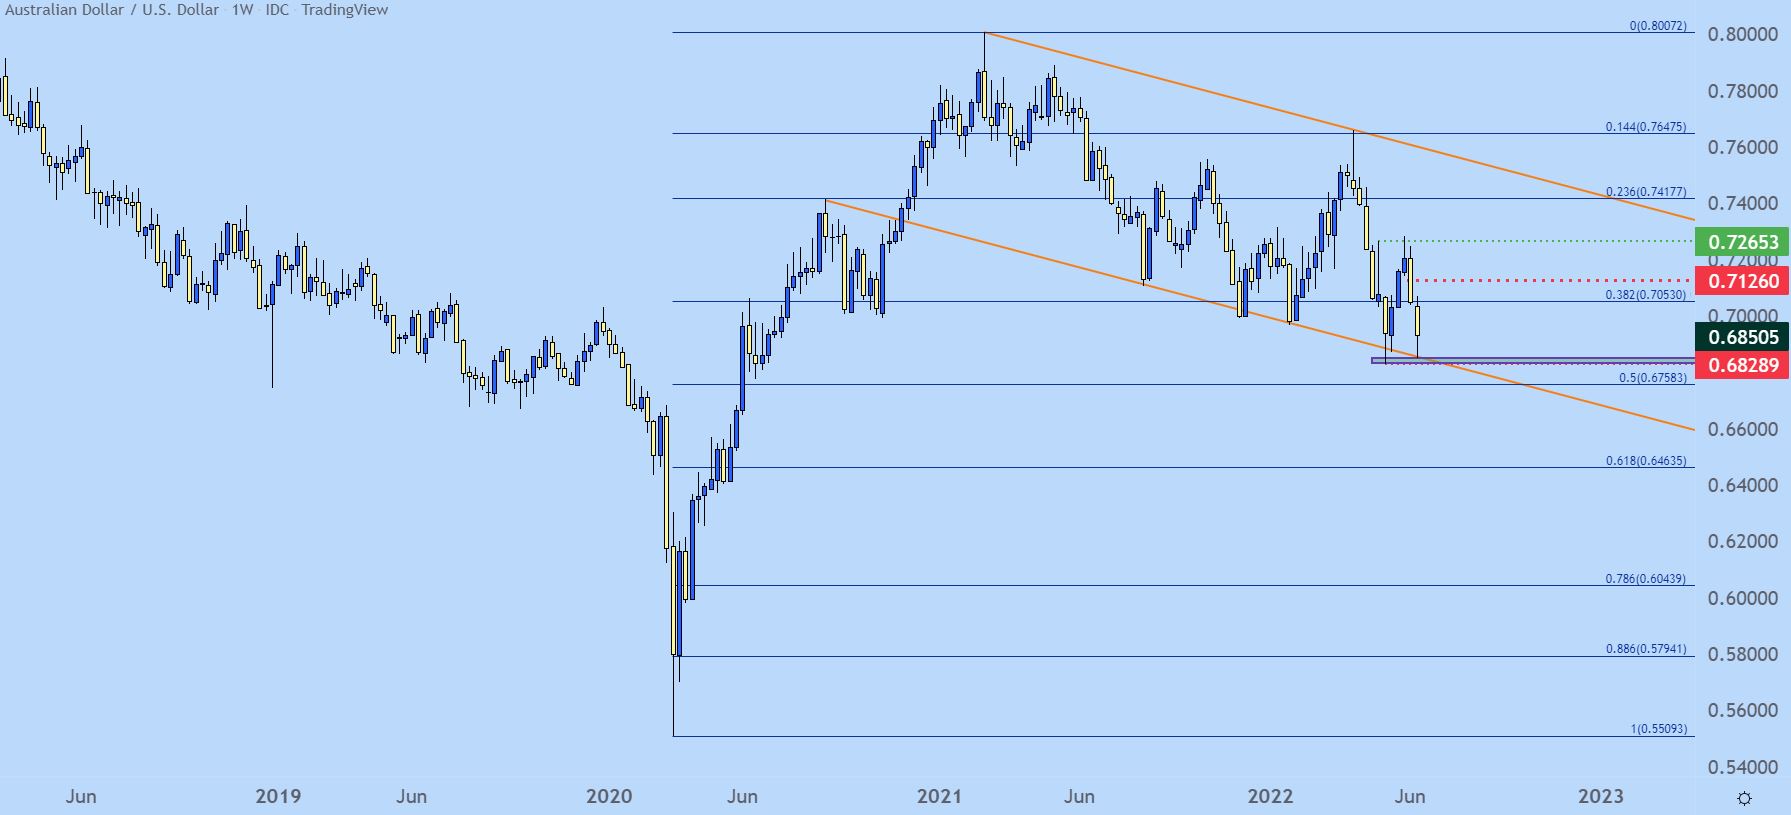
Chart prepared by James Stanley; AUDUSD on Tradingview
USD/JPY
At the close of business on Thursday it seemed as though markets had begun to build in the expectation for the BoJ to begin to grow more hawkish.
Coming into the month of June BoJ Governor Kuroda had, once again, shrugged off the inflation that’s being seen in Japan while seemingly opening the door for even more Yen-weakness. I had looked into this earlier in the month and that led to another fresh 20-year high in the USD/JPY that was set earlier last week.
But, Kuroda was forced to walk some of those comments back while apologizing to the Japanese public for downplaying the impact of inflation. A similar fury that’s been seen elsewhere but, in Japan, the Central Bank actually apologized to the public for it. Inflation hit 2.5% last month which is the highest level seen there since 2008. Kuroda said that the BoJ wanted to waited for ‘stable’ inflation before making any adjustments to policy.
As we moved towards the Thursday BoJ meeting, markets were beginning to expect some element of shift at the BoJ. USD/JPY had fallen back below the 132.00 handle and a number of Yen-pairs set up possible reversals. But, when we got to the meeting, the BoJ sounded as dovish as ever, saying that they were ‘closely watching’ developments in FX while making no claims or threats towards what they might do should the situation become even more untenable.
The direct response was a fast return of Yen-weakness and, already, the USD/JPY has pushed back up to the 135.00 psychological level and going into next week, topside continuation potential remains. Given current proximity of price, breakout potential remains. If a pullback does develop, higher-low support potential exists at both 133.22-133.41 and a bit-lower, from around 132.06-132.50.

USD/JPY Eight Hour Price Chart
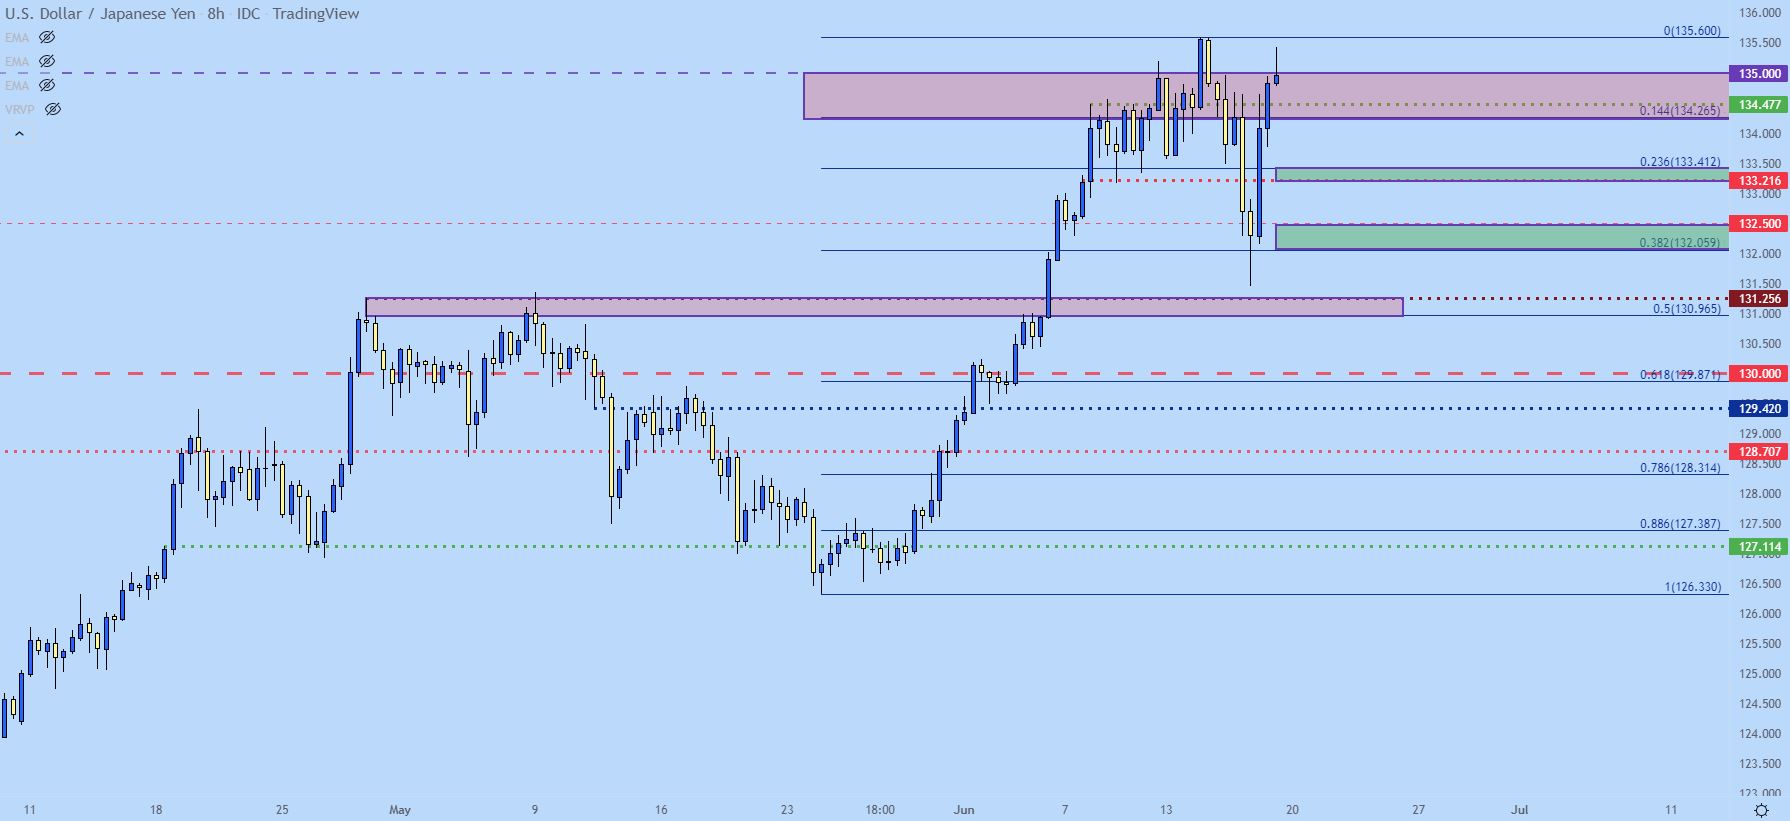
Chart prepared by James Stanley; USDJPY on Tradingview
--- Written by James Stanley, Senior Strategist for DailyFX.com
Contact and follow James on Twitter: @JStanleyFX


