


Indices Technical Forecast: Bearish
- S&P 500 broke trend support, has 200-day MA in focus
- Dow Jones looking to break below 200-day MA
- Nasdaq 100 outside of significant bullish channel
- Bonus Chart: Russell 2000 falling out of large congestion pattern

S&P 500 Technical Forecast
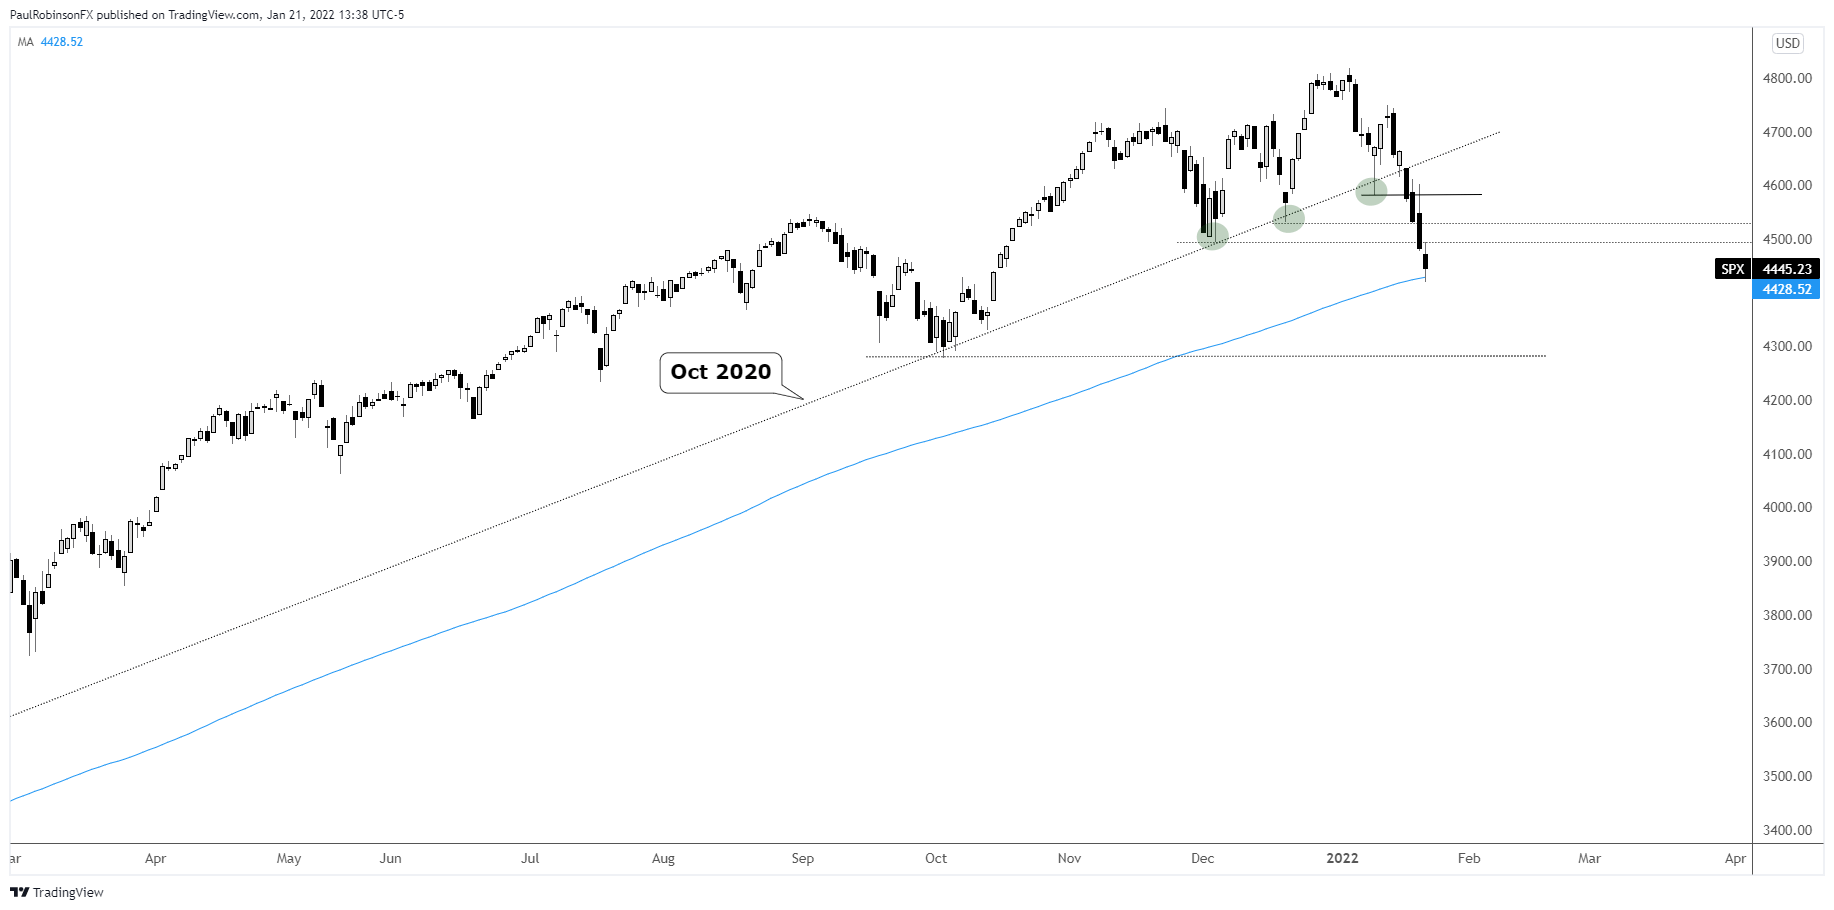
The S&P 500 finally failed a test of support this past week for the first time in quite some time, clearly putting the market on its heels. The break below 4582, the last low on the October 2020 trend-line, provided confirmation that more selling was likely on the way.
The recent slide now has the 200-day moving average squarely in play, and is seen as likely bringing a larger bout of volatility with it whether it holds or not. Expect some two-way trade as the largely-watched moving average gets tested for the first time since June 2020.
Generally speaking, the VIX is rising but not doing so in a panicky manner. This suggests the market isn’t fully embracing the decline as a threat. A sharp spike in the VIX at some point could mark the kind of fear that leads to a large bounce. For now, market conditions look best-suited for traders with short-term time horizons looking for two-way trade on higher vol.
S&P 500 Daily Chart
Dow Jones Technical Forecast
The Dow Jones is already seeing some breakage of the 200-day moving average. The next level below the 200-day to watch is the slope running over from the June low along with the December low at 34006.
Dow Jones Daily Chart
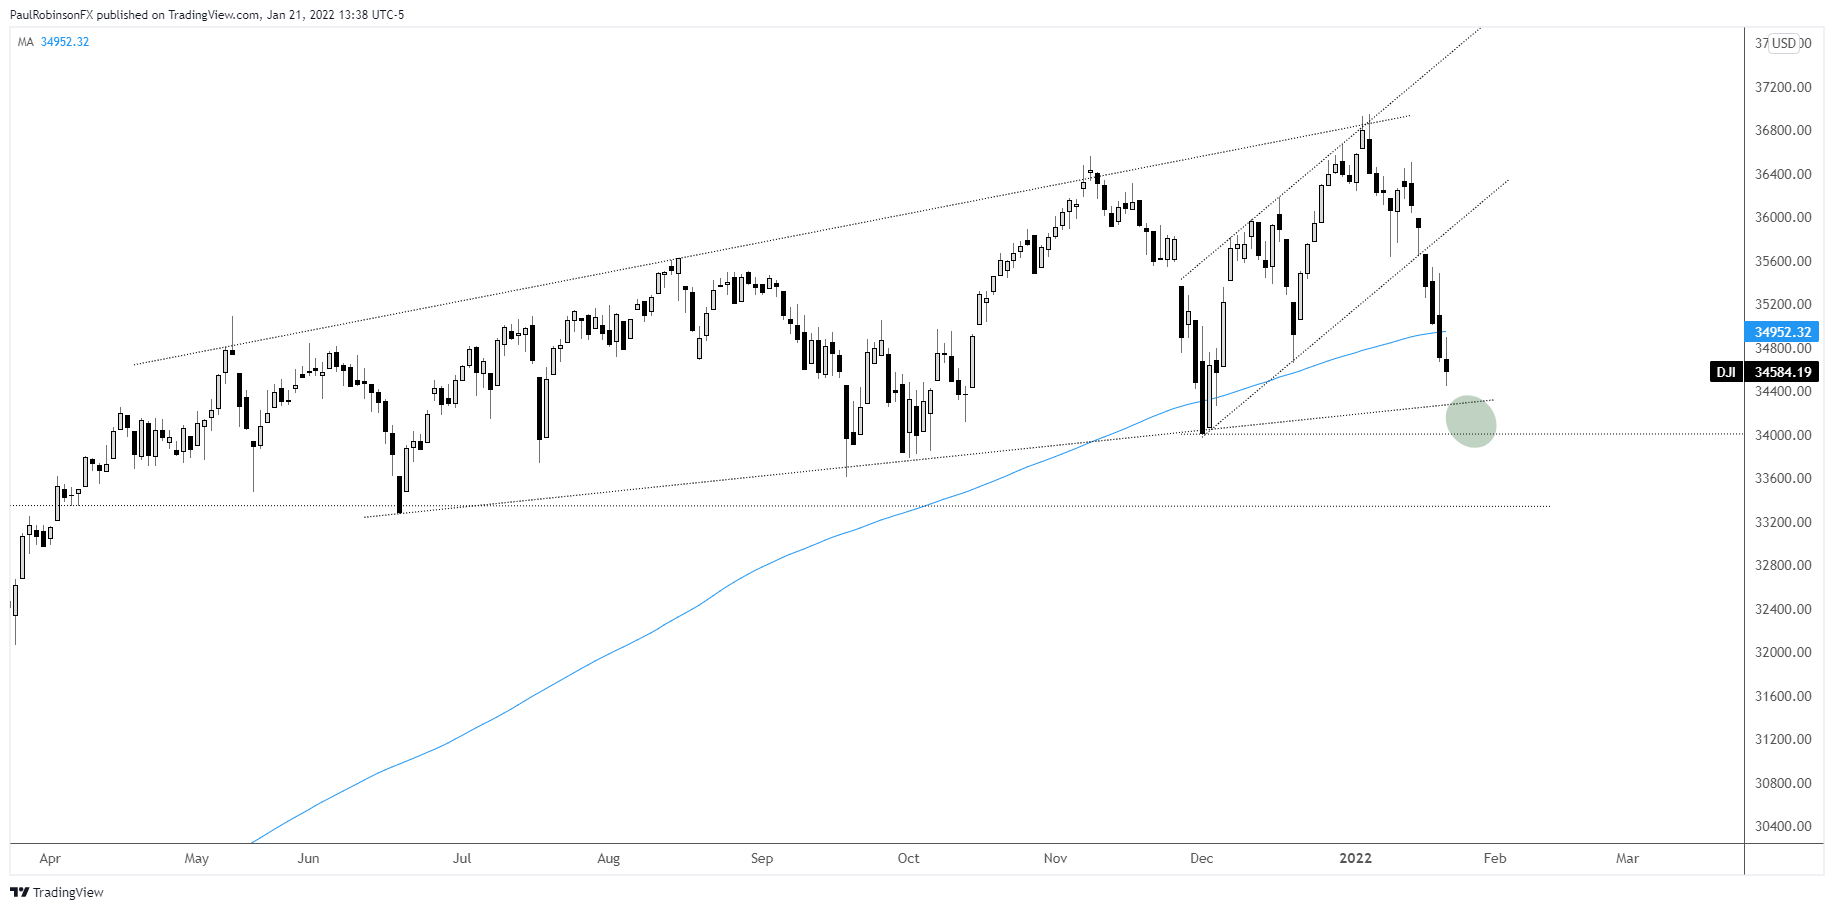
Dow Jones Chart by TradingView
Nasdaq 100 Technical Forecast
This is what I had to say in a recent weekly equity outlook: “The Nasdaq 100 is lagging behind quite a bit and is of concern for the broader market given its general leadership status.” Indeed, the concern was valid. The NDX is breaking out of a bullish channel dating to September 2020.
Even if we see a bounce here shortly from short-term oversold conditions, this development points to a much larger down-move. The next meaningful swing-low to watch arrives at 14384, the September low.
Nasdaq 100 Daily Chart
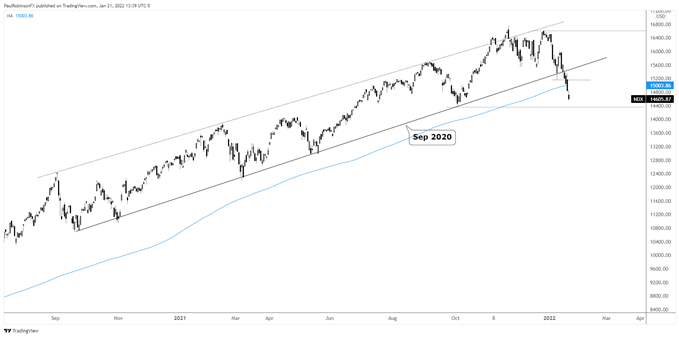
Nasdaq 100 Chart by TradingView
Bonus Chart: Russell 2000 breaking down in a big way
The small-cap index, Russell 2000, is breaking down in a big way, that like the Nasdaq 100 suggests we could be in for quite a bit more downside. Both the Russell and NDX are higher beta (risk) indices that when leading the market higher imply a larger appetite for risk by market participants, and when they are leading the way lower it suggests that the market is generally in defensive mode.
The R2K had been stuck in a range from Feb ’21 to Nov ’21 before breaking out to the top-side, but that top-side breakout quickly failed. Not only did the index fail back into the range, it is now falling out of the bottom of it.
Given the duration of the congestion pattern and confirmed breakdown, it may have just marked a major top. One that could lead to taking on much larger losses to the already 18% the Russell has suffered since the record high set in November.
In the near-term, any rallies to the bottom portion of the range (2085/2132) will be viewed as a retest and opportunity for would-be shorts.
Russell 2000 Daily Chart

Russell 2000 Chart by TradingView
Resources for Forex Traders
Whether you are a new or experienced trader, we have several resources available to help you; indicator for tracking trader sentiment, quarterly trading forecasts, analytical and educational webinars held daily, trading guides to help you improve trading performance, and one specifically for those who are new to forex.
---Written by Paul Robinson, Market Analyst
You can follow Paul on Twitter at @PaulRobinsonFX


