


Canadian Dollar, CAD, USD/CAD, CAD/JPY Technical Forecast: Mixed (see below)
- USD/CAD price action has retreated back to a significant area of support 1.2622-1.2672.
- CAD/JPY has extended its topside trend and has thus far spent the entire week above the 90.00 psychological level. The pair may continue to be a more attractive venue for long-CAD scenarios given the intense focus paid to the USD currently, along with the U.S. inflation data set to be released next week.
- The analysis contained in article relies on price action and chart formations. To learn more about price action or chart patterns, check out our DailyFX Education section.
It was a tale of two trends for USD/CAD this week. Both the week and the year began on a strong note, with the pair bouncing from a key zone of support that had come into play last Friday. This is the same area of support that held the lows earlier in December, and this area shows between two longer-term Fibonacci levels that demarcates this key spot on the chart between 1.2622 and 1.2672. Inside of this zone is another Fibonacci level, the 23.6% retracement of the 2020-2021 sell-off.
And there’s some relevant history here, as well, as this zone was helping to set support earlier last year until sellers were finally able to break-through, after which it became resistance in March and April.
USD/CAD Daily Price Chart
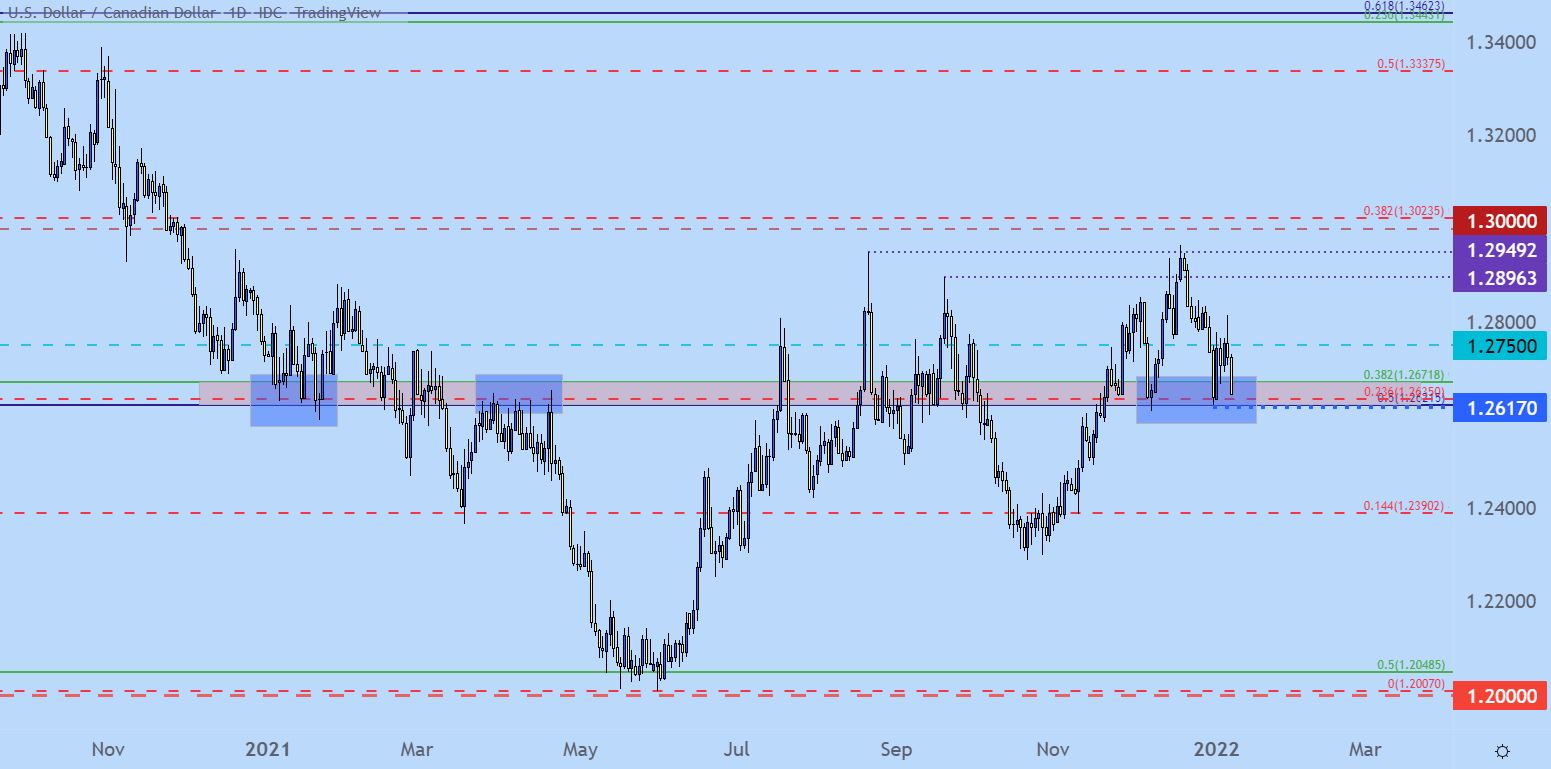
Chart prepared by James Stanley; USDCAD on Tradingview
USD/CAD Vulnerable to USD-Themes
Helping to drive the pair through this week’s price action was USD flow. The U.S. currency remains in what’s becoming a longer-term range, but after a bullish flare to start the week prices began to turn-around in the aftermath of the Friday NFP report. That’s what helped USD/CAD to pull back towards this very key area of support.
At this point, that support remains in-play and while it may give way to breakdowns should CAD-strength continue to show, the question remains as to whether USD/CAD would be the most attractive venue for such a scenario. Or, perhaps, could traders focus that CAD-strength expectation against another currency, such as the Japanese Yen which we’ll look at a little lower in this article.
In USD/CAD, that key zone of support is near-term support until it’s broken, and this can keep the door open for bullish USD and/or bearish CAD scenarios. Above current price action, the psychological level of 1.2750 looms large as this was the spot that helped to hold the resistance through this week. Beyond that, a spot around 1.2850 remains key, as this was a prior spot of resistance that bulls haven’t been able to hold above for very long just yet. And beyond that, the same 1.2950 that came in as the high for 2021 functions as an ‘r3.’
Underneath current price action – should this key zone of support give way, the next big spot on the chart is around the 1.2500 psychological level. Below that, 1.2390, and then 1.2255 function as s2 and s3 levels.
USD/CAD Technical Forecast: Neutral
USD/CAD Daily Price Chart (Levels Applied)

Chart prepared by James Stanley; USDCAD on Tradingview
CAD/JPY
Over the past few months as USD/CAD has been showing some element of mean-reversion on longer-term charts, I’ve been focusing bullish-CAD scenarios towards CAD/JPY. The technical juxtaposition of the pair is one of the primary reasons and from the monthly chart below, we can see a topside breach of a major trendline that took place through the second-half of last year, coupled with a support inflection around prior resistance in December.
CAD/JPY Monthly Price Chart
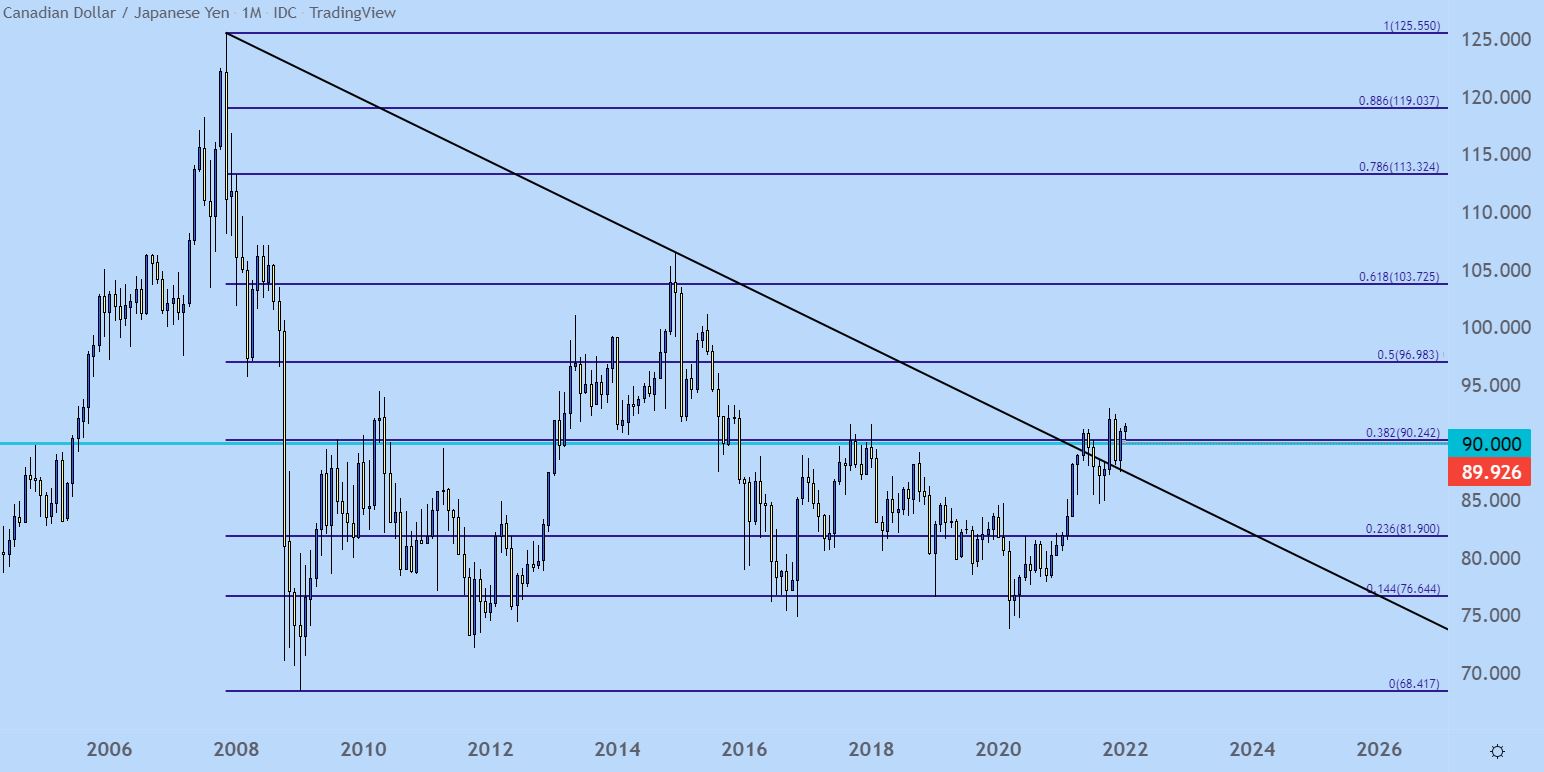
Chart prepared by James Stanley; CADJPY on Tradingview
CAD/JPY Shorter-Term
After a nasty two-month spill saw more than 500 pips erased from the spot price of the pair, support showed up around that trendline projection after which bulls made a pronounced re-entry back into the equation.
Along the way, buyers punched price back above the psychological 90.00 handle ahead of year-end, and so far this week prices have remained above this key spot on the chart without so much as a test of the big figure. I highlighted a support test here on Monday that has since seen bulls jump back on the bid.
Near-term price action remains in a precarious spot for bulls, posturing near the highs and fairly far away from nearby support. But, this does keep the door open for bullish scenarios which can come back into play with either a pullback to support running from 90.00-90.25 or, alternatively, a topside breakout beyond the 91.66 high.
CAD/JPY Technical Forecast: Bullish
CAD/JPY Four-Hour Price Chart

Chart prepared by James Stanley; CADJPY on Tradingview
--- Written by James Stanley, Senior Strategist for DailyFX.com
Contact and follow James on Twitter: @JStanleyFX


