


Pound Sterling Technical Forecast
- GBP/USD looking vulnerable to the high flying dollar at confluence zone
- EUR/GBP on the radar following resurgence of UK and NI friction
- GBP/NZD: recent bullish reversal showing signs of a slow down
GBP/USD Technical Forecast: Bearish
GBP/USD has surrendered a lot of ground against the dollar as it attempts once more to break below the sizeable descending channel. The extended bearish run began in the lead up to the November 4th Bank of England (BoE) policy meeting and accumulated after the committee decided against a rate hike despite one being largely priced in by rates markets at the time.
Recent price action looks to have attempted to halt the selling momentum at a key zone of confluence (circled in yellow) around the psychological level of 1.3400, the prior low at 1.3410 and the lower side of the descending channel.
The bearish setup however, is conditional upon resultant price action in the early stages of next week. GBP bears will be looking for a daily close below Friday’s low for greater conviction of the bearish setup. This condition appears necessary for greater conviction of the bearish setup given the previous, almost identical, false breakout at the end of September.
GBP/USD Daily Chart

Chart prepared by Richard Snow, IG
The weekly chart highlights the potential target zone of a successful channel breakdown which appears via the 1.3200 – 1.3280 zone (red rectangle). The next significant level of resistance appears some way down the road at 1.2770 which is more of a longer term target.
GBP/USD Weekly Chart

Chart prepared by Richard Snow, IG
IG client sentiment shows a massive 77% net-long positioning, with recent additions to longs outweighing additions to shorts, providing a strong bearish trading bias.
| Change in | Longs | Shorts | OI |
| Daily | 3% | -7% | -3% |
| Weekly | 4% | -10% | -5% |
EUR/GBP Technical Forecast: Mixed
EUR/GBP warrants more attention due to a resurgence of the friction between the UK and the EU regarding the Northern Ireland Protocol.
The EUR/GBP charting landscape is challenging with a slow and inconsistent downtrend however, the potential for selling into Euro strength may present viable opportunities. EUR/GBP has traded higher since bottoming out in October and now rests above the 0.8540 support level.
Prior price action had revealed great difficulty when attempting to rise above the 0.8640 level with a large sell-off ensuing shortly after. Therefore, in the event of Euro strength, further GBP weakness, or both, there could very well be an opportunity to look for a bearish reversal near the 0.8640 mark.
Admittedly, it may take more than a week to get to 0.8640 which is why the directional tag on this trade is ‘mixed’.
EUR/GBP Daily Chart
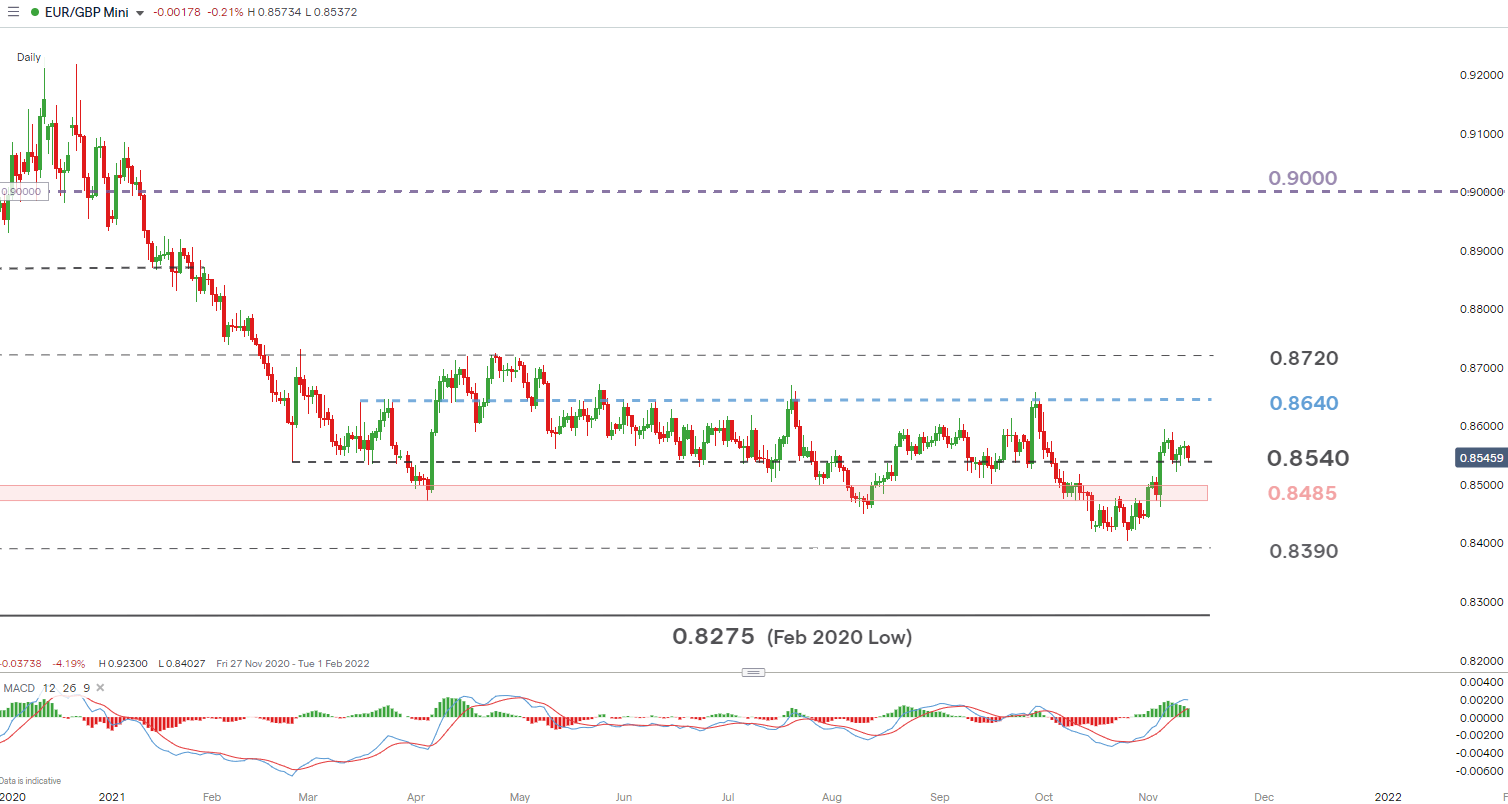
Chart prepared by Richard Snow, IG
Fittingly enough, IG Client Sentiment approaches parity as far as net-long and net-shorts are concerned with insignificant recent moves in either direction, presenting a mixed EUR/GBP trading bias.
| Change in | Longs | Shorts | OI |
| Daily | -4% | -2% | -4% |
| Weekly | -9% | 5% | -6% |
GBP/NZD Technical Forecast: Slightly Bearish
GBP/NZD is nearing its latest test of the red zone (with the mid-point at 1.9160) which has acted as support and resistance on multiple occasions in the past. Given this significance, it remains to be seen whether the recent bullish price action has enough momentum to break above 1.9160.
However, relatively long upper wicks have been observed recently as price approached the significant level before bears brought the candles to a close some way off the highs. This tends to suggest a lack of bullish momentum and may result in continued selling into next week despite convincingly reversing off the recent low under oversold conditions (RSI).
GBP/NZD Daily Chart
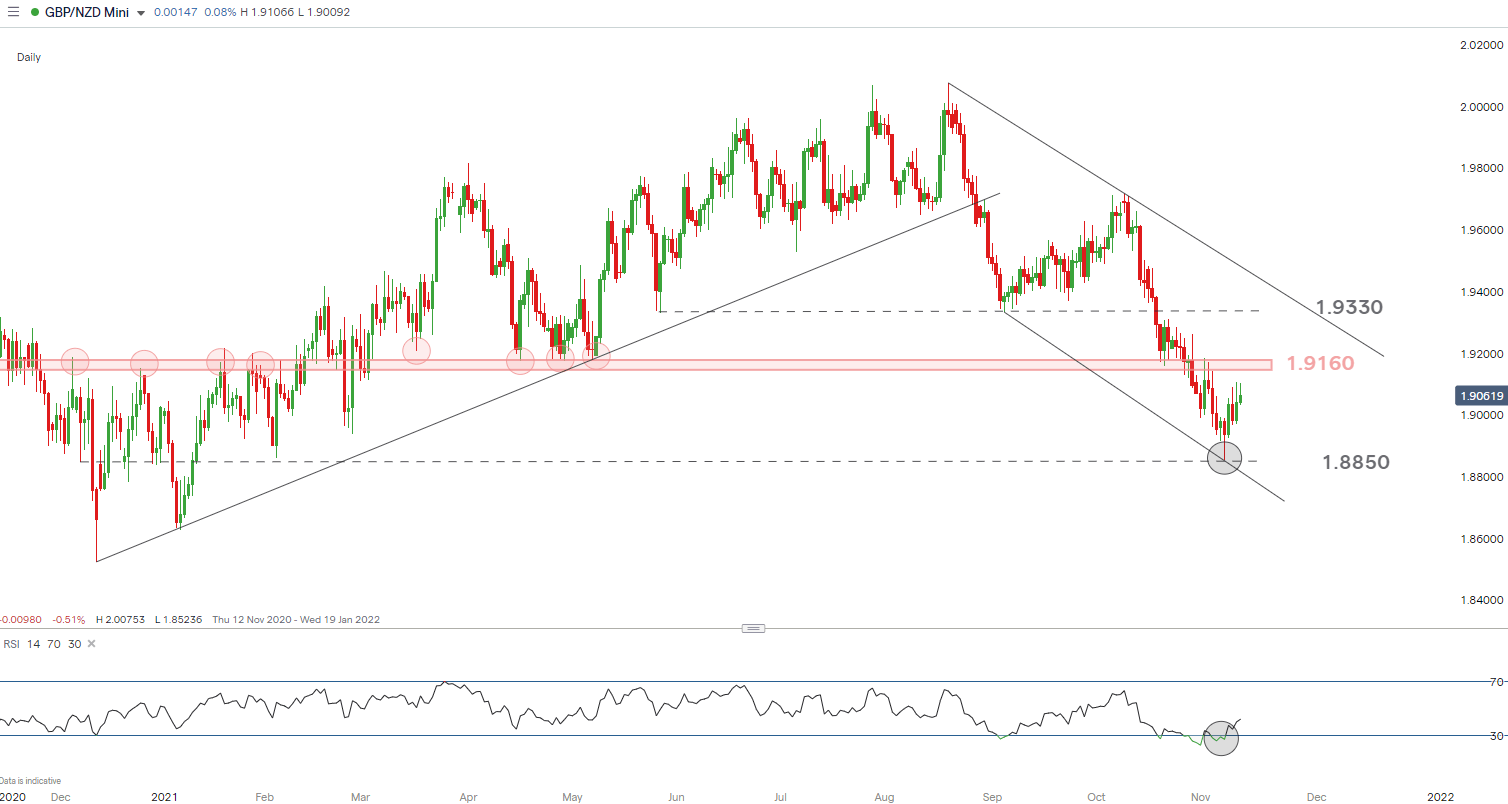
Chart prepared by Richard Snow, IG
According to IG.com 50% of clients are short the reverse pairing (NZD/GBP) and therefore, no actionable information can be acquired from the contrarian indicator.
--- Written by Richard Snow for DailyFX.com
Contact and follow Richard on Twitter: @RichardSnowFX


