


Crude Oil Technical Forecast: Bullish
- Bull flag suggests a bullish bias after $80 mark surfaces as key support level
- Crude Oil approaches a key historical level, but still some way to go
- IG Client Sentiment however, indicates that a further pullback remains viable as positioning flips from 60% net short to 60% net long in a matter of days
Weekly Oil Recap
Crude started the week positively, trading closer to the yearly high. Since then the commodity dropped by around 4.3% (at 14:00 GMT) but dropped as low as 5.5% from the daily Monday close. The recent volatility around OPEC + and continuing calls from US President Joe Biden for the cartel to raise output levels faster than they have planned, saw oil move 5% on Thursday before closing just beneath its opening level to end the day relatively flat.
Crude Oil Technical Analysis and Key Levels
The Thursday and Friday candles interestingly enough showed a significant rejection of prices lower than $80 (observed by the extended lower wicks) and Friday saw a concerted move well above the previous low at 81.95. This move adds to the bullish narrative suggested by the bull flag, which has encapsulated the larger pullback thus far.
The bull flag is just one of many technical patterns that play out in financial markets. Head to our Education section to learn more
Depending on the weekly close, 80.00 remains the major level of support which could move up to 81.95/82.00. Initial resistance 82.80, followed by the upper bound of the descending channel before a retest at 86.67 (which coincides with the 161.8% Fib of the July – August move) is considered.
Daily Crude Oil Chart
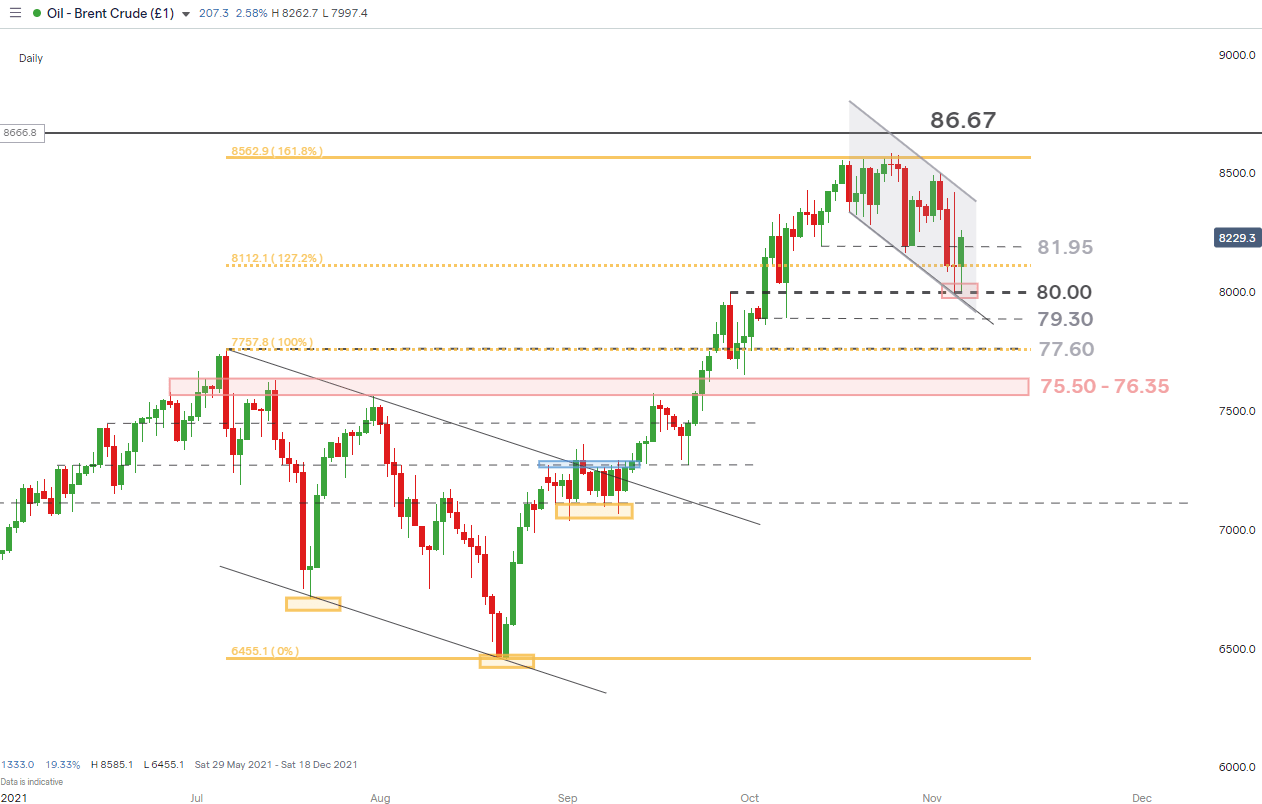
Chart prepared by Richard Snow, IG

Long-Term Technical Outlook for Crude Oil
From a historical perspective, oil is nearing a significant level that has provided numerous inflection points in the past and that is the 8667, or near the 8670 mark for those preferring a more convenient, rounded figure. If we are to see significant bullish momentum and potential break above this level then there is very little standing in the way before the commodity reaches $100.
Its crucial to note that both times we saw a break above this level (in the last 17 years) the bullish momentum that followed was relentless with little or no consolidation. However, Oil prices have come off somewhat after the yearly high in October so we would need to see a validation of the bull flag with a rather consistent move higher after breaking above the ‘flag’.
Monthly Crude Oil Chart

Chart prepared by Richard Snow, IG
IG Client Sentiment Warns of a Deeper Correction
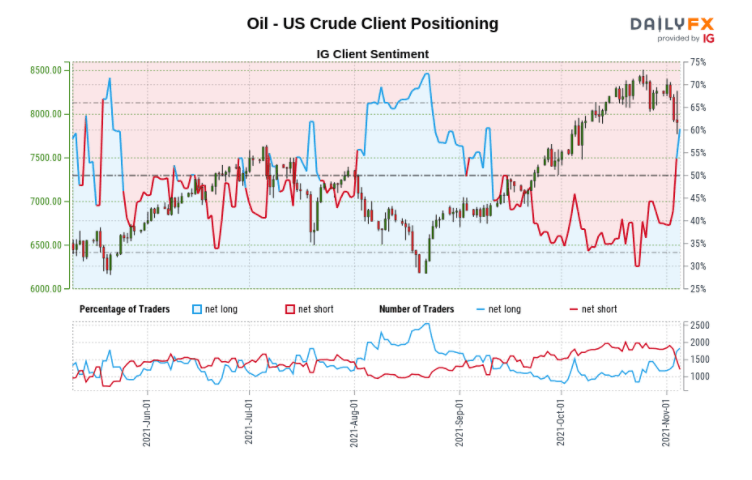
Chart prepared by Richard Snow, IG
- Oil - US Crude: Retail trader data shows 59.17% of traders are net-long with the ratio of traders long to short at 1.45 to 1.
- We typically take a contrarian view to crowd sentiment, and the fact traders are net-long suggests Oil - US Crude prices may continue to fall.
- The number of traders net-long is 10.09% higher than yesterday and 39.67% higher from last week, while the number of traders net-short is 10.33% lower than yesterday and 30.86% lower from last week.
- Traders are further net-long than yesterday and last week, and the combination of current sentiment and recent changes suggests a stronger Oil - US Crude-bearish contrarian trading bias.
| Change in | Longs | Shorts | OI |
| Daily | 3% | -7% | 1% |
| Weekly | 31% | -38% | 7% |
--- Written by Richard Snow for DailyFX.com
Contact and follow Richard on Twitter: @RichardSnowFX


