UK Pound Sterling (GBP), US Dollar (USD) Technical Forecast: Neutral
- GBP/USD loses traction at critical resistance
- Fundamental factors may continue to impact Cable prices as central banks remain under pressure
- British pound (GBP)US dollar (USD) technical levels to watch


GBP/USD Pauses at Psychological Resistance
The upward momentum recently seen in GBP/USD has recently lost traction at the key psychological level of 1.3600.
With inflationary pressure on the rise, global debt and increased geopolitical risks, fundamental factors will likely play an additional role in the performance of the Pound against major currency pairs for the remainder of the year.
Visit DailyFX education to learn more about technical and fundamental analysis
As both the BoE (Bank of England) & the Federal Reserve now turn slightly more hawkish, soaring energy prices may continue to assist with the catalyzation of price action for the imminent move.
Technical Analysis: Have GBP Bulls Run Out of Steam?
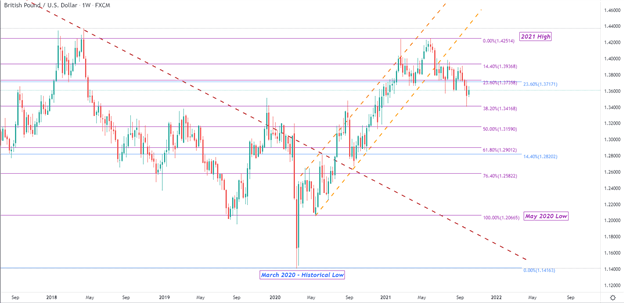
After falling below the channel formation on the weekly chart, the 23.6% fibonacci retracement of the historical move (2007 – 2020) has continued to hold both bulls and bears at bay, pushing price action into a well-defined range between 1.3600 and 1.3900 respectively.


GBP/USD Weekly Chart

Chart Prepared by Tammy Da Costa on TradingView
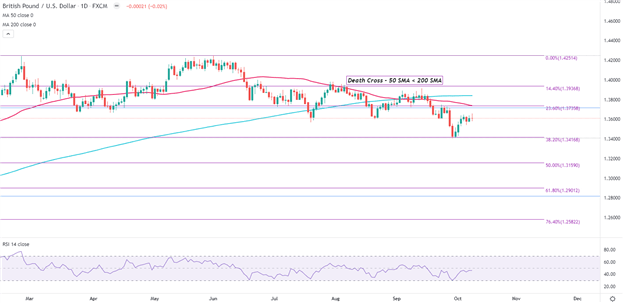
Since the formation of a death cross on the daily time-frame, price action temporarily edged higher before falling back below prior trendline support turned resistance and below both the 50 and 200-day moving average (MA).
As long as the 23.6% fibonacci levels of both the long and short-term moves continue to hold firm, the momentum of the uptrend remains under pressure.
GBP/USD Daily Chart

Chart Prepared by Tammy Da Costa on TradingView
GBP/USD Key Levels
Currently, critical levels of resistance for the imminent move exist at 1.360 and 1.373, with a breach of that latter price opening the door for a continuation move towards 1.400.
For GBP/USD bears, a break below the 61.8% retracement of the above-mentioned move at 1.3420 could see the next level of support coming into play at the key psychological level of 1.3200.
| Change in | Longs | Shorts | OI |
| Daily | 3% | -7% | -3% |
| Weekly | 4% | -10% | -5% |
--- Written by Tammy Da Costa, Analyst for DailyFX.com
Contact and follow Tammy on Twitter: @Tams707


