


Gold Technical Forecast: Neutral
- Gold prices put in a strong move on Friday to break above an area of resistance in the 1804-1808 zone.
- Another significant level of resistance lurks overhead at 1834.
- The analysis contained in article relies on price action and chart formations. To learn more about price action or chart patterns, check out our DailyFX Education section.

The month of August isn’t quite over yet but it’s been a notable outing for Gold. It was a little more than three weeks ago when Gold put in a ‘flash crash’ like move after the weekly open, plummeting down towards the 1680 level that currently marks the 2021 low. That move marked an -7.3% loss from the August open, and support set-in shortly after the sell-off.
Since then, however, buyers have clawed back the entirety of that sell-off, with Gold prices breaking through a key zone of resistance this week. The zone in question runs from 1804-1808 and was showing as support earlier in the month. I had looked at this area on Monday as price action had just begun to re-engage with this zone as resistance, setting the table for bullish breakout potential. Chair Powell helped with the rest, as the statement at Jackson Hole helped bulls to finally re-drive above this area on the chart.
Gold Four-Hour Price Chart

Chart prepared by James Stanley; Gold on Tradingview
Sitting just ahead for Gold prices is another big level on the chart and this was a price that Gold was unable to break despite two separate attempts in July and one in early-August. This shows up at 1834, and that can be connected with the 1825 Fibonacci level to create a zone that’s now very nearby.
The bigger question is whether bulls can make it through after three failed attempts over the past couple of months. Likely, some additional USD weakness will be necessary and if we’re deducing recent drivers, that would likely need to come in the form of more dovish FOMC surprises. Next week’s Non-farm Payrolls report will likely be widely-watched for this, considering that Chair Powell continues to point at the labor market as the rationale for remaining ‘pedal-to-the-floor’ on the accommodation front. And expectations for next week are high as markets are looking for +728k jobs to have been added to go along with a reduction in the unemployment rate to 5.2% from the current 5.4% read.
To learn more about Non-farm Payrolls, check out DailyFX Education
This could be a difficult scenario given the continued growth in Covid numbers as driven by the delta variant, and disappointing prints around NFP could be construed as a driver of USD-weakness and, potentially, Gold strength.
Gold Daily Price Chart

Chart prepared by James Stanley; Gold on Tradingview
Gold Prices Longer-Term
Taking a step back to the weekly chart and there remains some bullish scope here. The key, of course, is going to be buyers continuing to re-take control after the longer-term bullish trend has been backing down for more than a year. It was August 7th of last year when Gold prices set their all-time-high at 2075, and it was in this same weekly technical forecast that I warned of a pullback.
Well that pullback turned into something more and now, a year later, prices still have yet to recover back to the 2000 psychological level. That pullback has taken on the form of a bearish channel, however, and when combined with the prior bullish trend, that makes for a bull flag formation that can keep the longer-term approach looking to the long side. The bigger question at this point is one of timing and, likely, the matter is going to need some help from the FOMC and the USD for Gold prices to get back on the track of that longer-term bullish trend.
To learn more about psychological levels, Fibonacci or Bull Flags, please check out DailyFX Education
Gold Weekly Price Chart
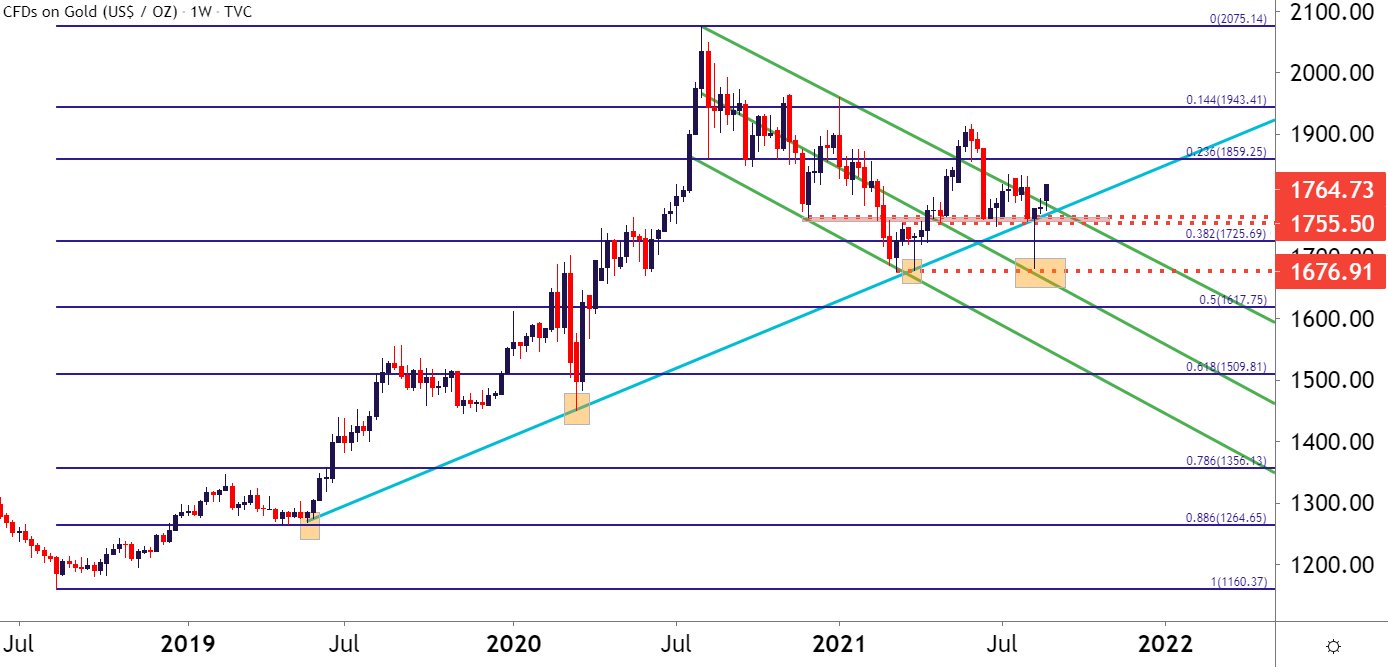
Chart prepared by James Stanley; Gold on Tradingview
--- Written by James Stanley, Senior Strategist for DailyFX.com
Contact and follow James on Twitter: @JStanleyFX


