


US Dollar Technical Forecast: Bullish
- The US Dollar set a fresh three-month-high on the back of a strong headline number in the Non-farm Payrolls report.
- US Treasury rates have been surging so far in 2021 and this has helped to create a sharp move in the USD/JPY pair.
- The analysis contained in article relies on price action and chart formations. To learn more about price action or chart patterns, check out our DailyFX Education section.
The general consensus coming into this year was for a continued combination of equity strength helped along by a weak US Dollar. And to be sure, the basis which seemed to drive that prognostication remains the same – the Fed remains loose and dovish with little indication of any impending rate hikes, echoed again by Chair Powell last week. But we’re in one of those strange periods where markets appear to be going in the opposite direction as US rates continue to lift even as most inflation indicators remain tame and subdued. This isn’t to say that there isn’t inflation, as one look at commodities like Copper, Lumber or Tin highlight some pretty sizable price gains; and this is likely playing at least somewhat of a factor in that continued divergence between rates markets and what the Fed says that they want to do. But as rates continue to lift in anticipation of a greater recovery, the US Dollar has continued to trade higher, setting a fresh three-month-high earlier this morning on the back of a really strong Non-farm Payrolls report.
The US Dollar is testing a confluent spot of resistance ahead of the weekend, marked by a 23.6% Fibonacci retracement at 91.93 and the underside of a prior bullish trendline that projects into the same vicinity. The Dollar did test above this level in the aftermath of NFP, albeit temporarily, before prices quickly pushed back to this key area on the chart.
To learn more about Fibonacci retracements – or to learn more about trendlines, join us in DailyFX Education
US Dollar Daily Price Chart
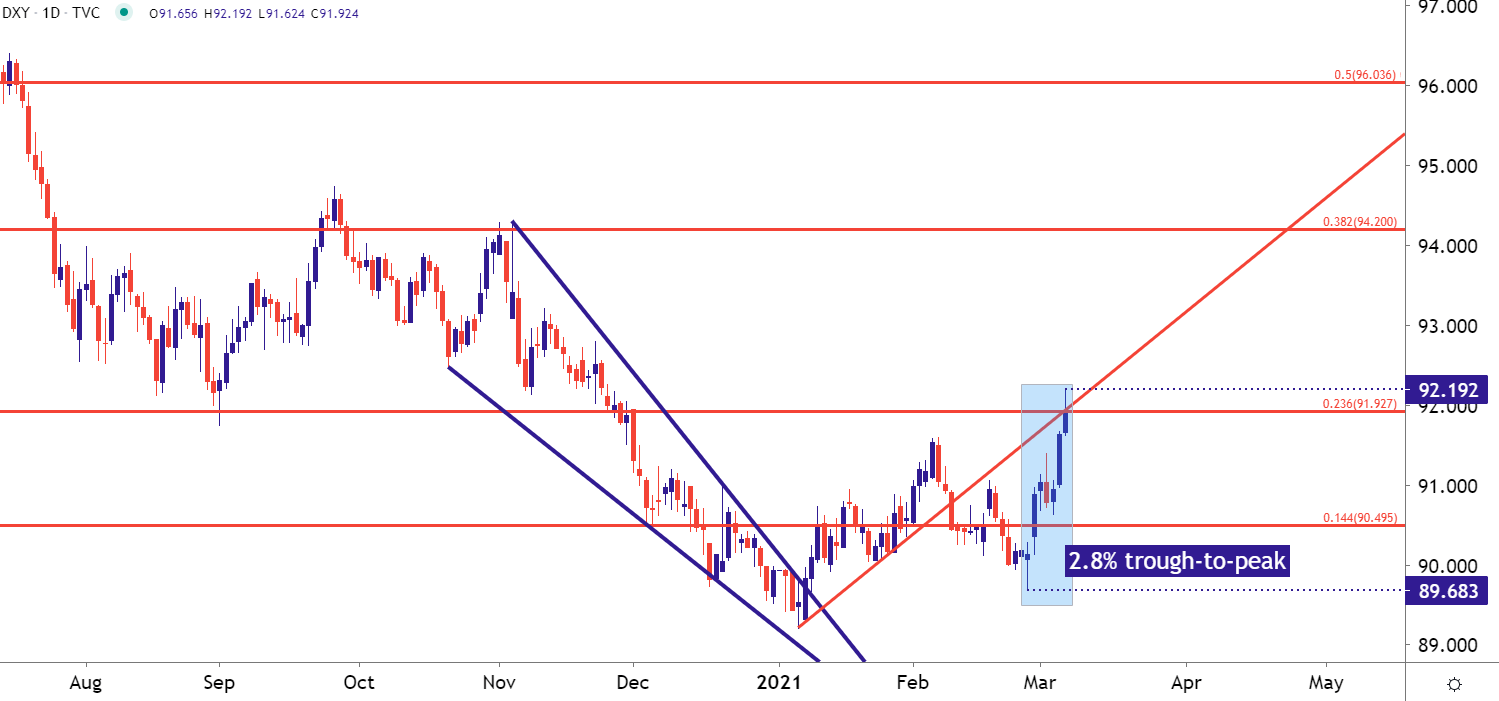
Chart prepared by James Stanley; USD, DXY on Tradingview
The big driver here appears to be of the fundamental variety and with the FOMC now moving into a blackout period ahead of their next rate decision – the focus begins to shift towards that announcement scheduled for March 17th at 2PM ET.
There are two major questions for this upcoming rate decision: How much optimism will get priced-in to the updated dot plot matrix. And is the Fed considering any additional strategies as rates have become unanchored across the yield curve. Until then, expect posturing in the US Dollar as that longer-term short-side theme continues to give back some of the 2020 losses that had built-in.

On a technical basis, given the recent establishment of a fresh three-month-high combined with the prevailing trend, it would appear that shorts are being squeezed to a degree. On a relative basis, however, we haven’t even seen 23.6% of that 2020 sell-off re-claimed, so if buyers are going to drive, there’s considerable room-higher on the chart for that trend to run towards.
The 23.6% retracement of the 2020 sell-off plots around the psychological level of 92.50, and this could function as an ‘r1’ level in the USD. There’s a collection of prior price action swings in the 93.50 area, and this could serve as an ‘r2’ type of level, and above that is another area of interest from 94.20-94.50, very near the home of the current six month high.
Underneath USD price action, the 91.50 can function as an ‘s1’ area, while ‘s2’ would be just slightly lower, around the 91.00 handle that showed as resistance last week. And below that is the psychological 90.00 level on DXY that’s so far served as a stubborn spot of support for the Greenback.
US Dollar Daily Price Chart
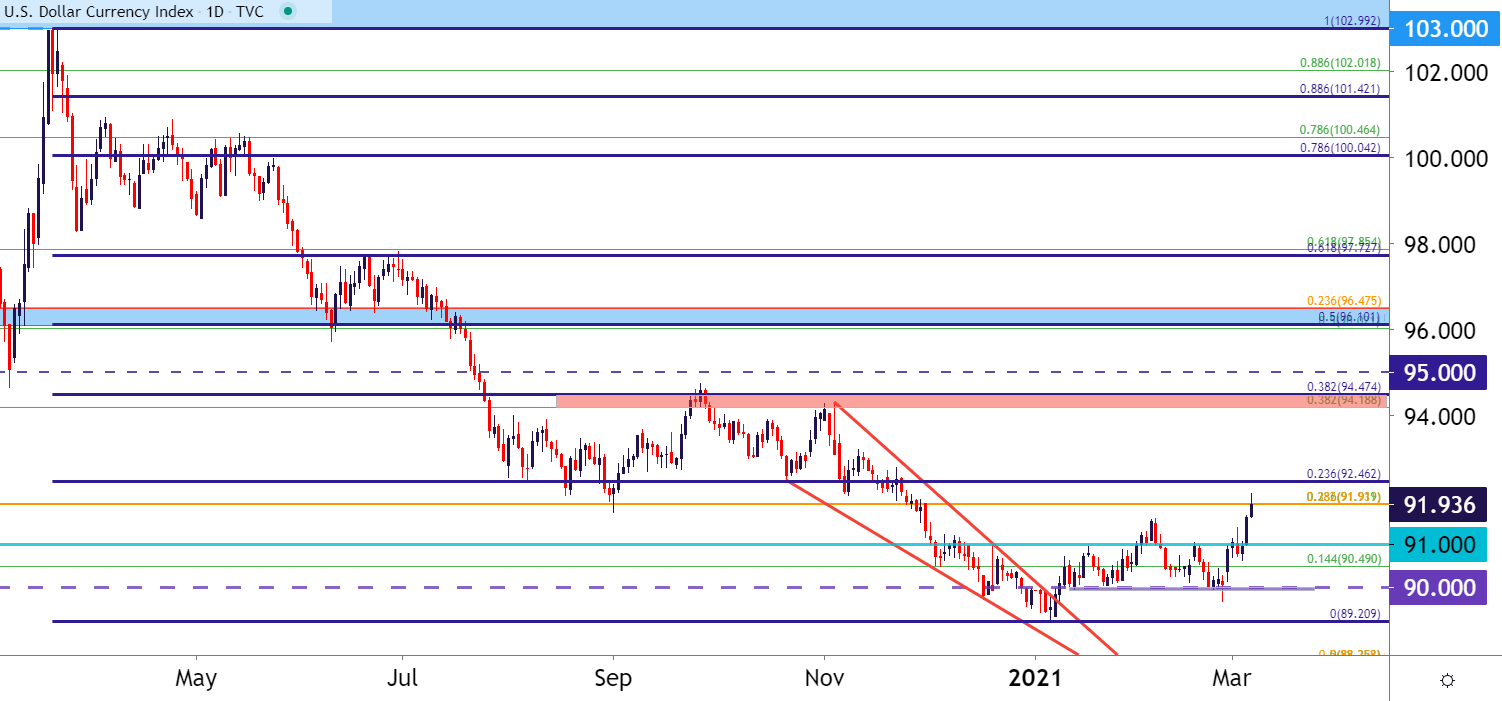
Chart prepared by James Stanley; USD, DXY on Tradingview
EUR/USD Breaches 1.2000 – Are Euro Bulls Done For?
Euro fundamentals remain in a precarious spot, and there’s also an ongoing bit of mystery around what the bank may actually do to quell a surging currency amidst a lack of inflation. There were some comments this week on that topic, but as discussed by our own Justin McQueen, there wasn’t exactly much clarity there. While the door was seemingly opened to increasing bond buys, just a day later a conflicting report began to circulate indicating that the European Central Bank isn’t in much of a hurry.
Nonetheless, the technical move in the pair was fairly clear as EUR/USD broke down to a fresh three-month-low. Prices found a bit of support off of the 1.1900 level ahead of the weekend; but taking a step back presents a bull flag formation that can keep the door open for bullish continuation themes, particularly if expectations begin to build for another round of USD-weakness.
To learn more about how to work with bull flags, join us in DailyFX Education
EUR/USD Daily Price Chart
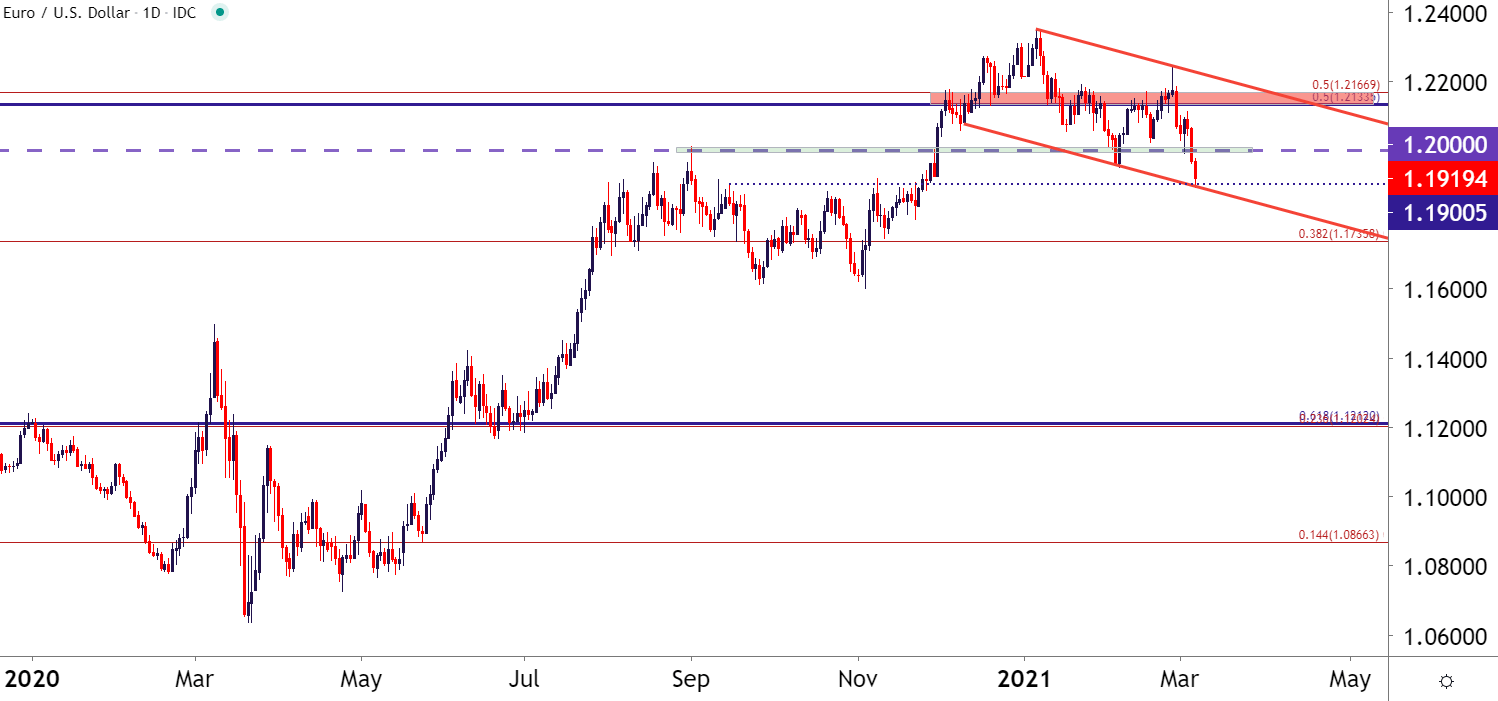
Chart prepared by James Stanley; EURUSD on Tradingview
USD/JPY: Trying to Go To the Moon?
Perhaps surprisingly, at least to me, is the trend that’s developed in USD/JPY amidst the recent noise. USD/JPY has put in an extremely sharp topside move to go along with that push in US rates, and the pair is now at its most overbought since 2016 (from the Daily chart).
The big question, of course, is one of continuation; and while the technical setup here screams caution towards chasing, if the rates move continues, so can USD/JPY. Taking a step back the falling wedge formation that had built in the pair coming into the year has led into an aggressive topside breakout.
For next week – pullback potential for higher-low support exists around 108 and 107.50, both psychological levels.
To learn more about psychological levels, join us in DailyFX Education
USD/JPY Daily Price Chart
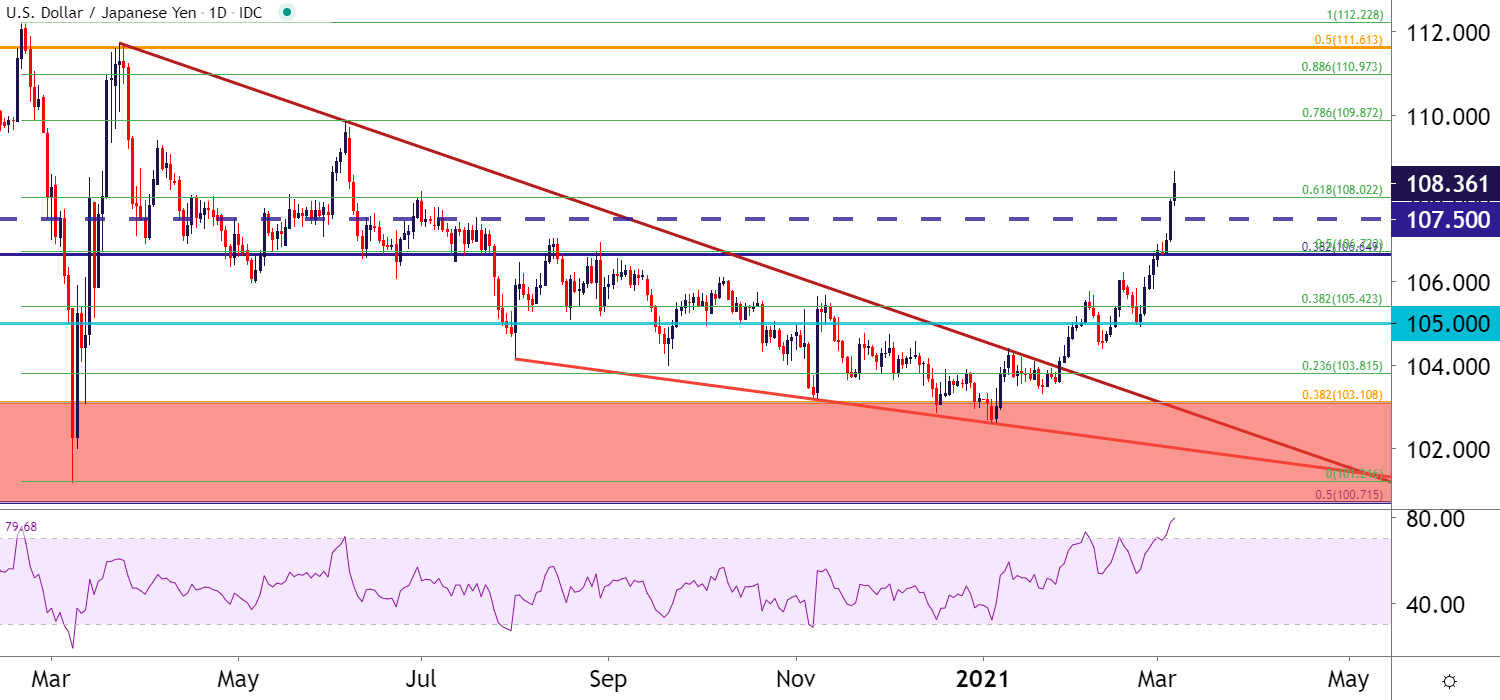
Chart prepared by James Stanley; USDJPY on Tradingview
USD/CAD Coils
I had written about USD/CAD last week, specifically looking at wasn’t happening as the US Dollar was budging up to that fresh three-month-high. Strong moves in Oil prices have helped to keep CAD as relatively strong, so even though the Dollar was breaking out against both the Euro and the Yen, USD/CAD remained within prior structure, continuing to grind support around a key Fibonacci level at 1.2622.
What could be of interest here is a re-emergence of US Dollar weakness, in which case that strong Canadian Dollar could begin to shine a bit more brightly, possibly posing a revisit to the 1.2500 support level that came in as rigid support two weeks ago. Buyers have had ample opportunity to make a mark after the 1.2500 support bounce: But that hasn’t yet happened, and this keeps the door open to bearish potential should USD-sellers re-enter the equation at some point ahead of the March FOMC rate decision.

USD/CAD Daily Price Chart

Chart prepared by James Stanley; USDCAD on Tradingview
--- Written by James Stanley, Senior Strategist for DailyFX.com
Contact and follow James on Twitter: @JStanleyFX


