


Gold Technical Price Outlook: XAU/USD Weekly Trade Levels
- Gold price updated technical trade levels - Weekly Chart
- XAU/USD coils into August trading range- breakout imminent in the days ahead
- New to Gold Trading? Get started with this Free How to Trade Gold -Beginners Guide
Gold prices rallied more than 0.7% this week but keeps XAU/USD within the confines of a multi-month consolidation pattern. The immediate focus is on a break of this formation with bullion still at risk for a deeper correction while below technical resistance. These are the updated targets and invalidation levels that matter on the gold weekly charts.
Gold Price Chart - XAU/USD Weekly
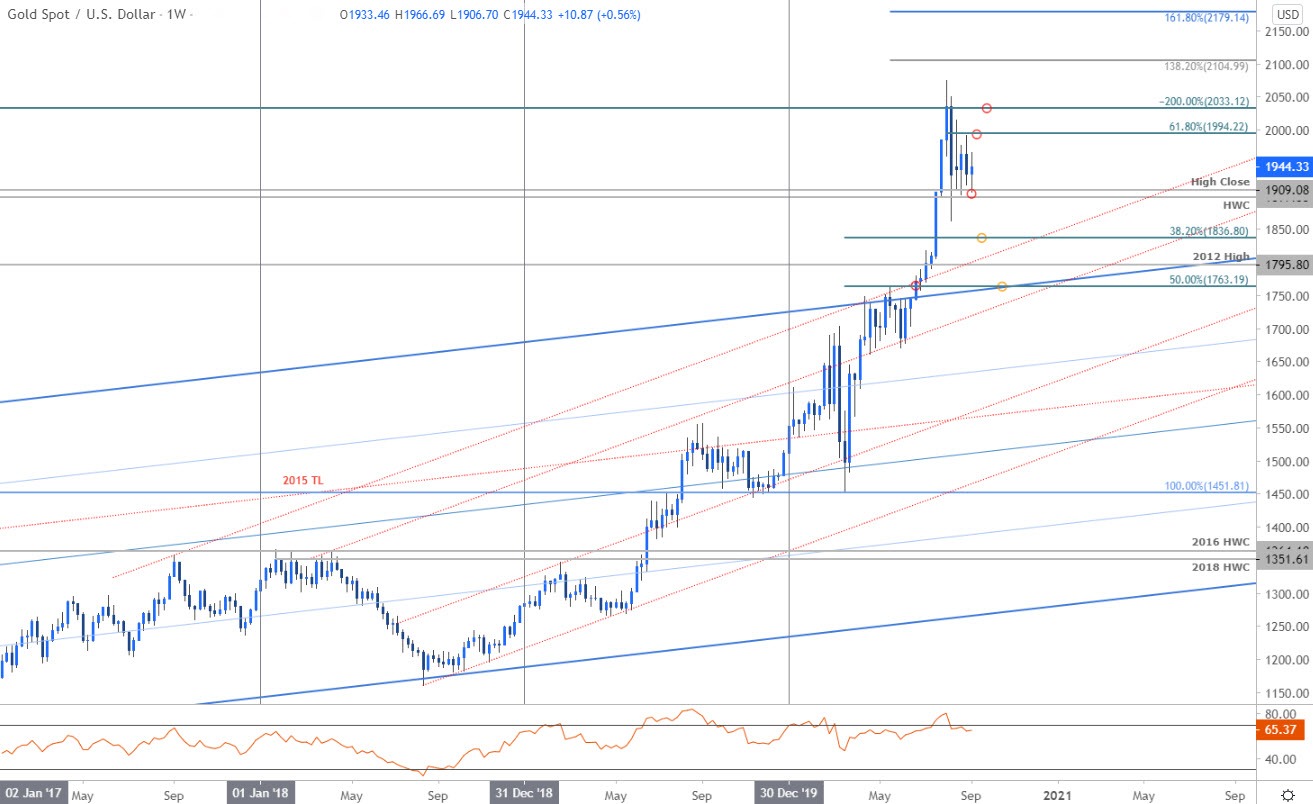
Chart Prepared by Michael Boutros, Technical Strategist; Gold on Tradingview
Notes: In last month’s Gold Weekly PriceOutlook we noted that the, “gold breakout remains vulnerable on the back of this stretch,” and ultimately we’re on, “the lookout for downside exhaustion while above 1795 IF price is indeed heading higher.” The outlook remains unchanged nearly three-weeks later with XAU/USD trading within the confines of a contractionary range just above confluence support at 1897-1909- a region defined by the 2011 high-week close / high close.
Initial weekly resistance is eyed at the 61.8% Fibonacci retracement of the August for range at 1994- their risk for a deeper correction remains well below this threshold with a breach/close above 2033 needed to mark resumption of the broader uptrend. A downside break of the range would keep the focus on subsequent support objectives at the 38.2% retracement at 1836 and the 2012 high at 1795-both levels of interest for possible downside exhaustion it for reached.

Bottom line: Gold prices are in consolidation just above confluence support and we’re looking for a breakout to offer guidance. From a trading standpoint, the risk remains for a deeper correction while below 1994- be on the lookout for an exhaustion high-day while below this threshold with a break/close below 1897 needed to suggest a larger pullback is underway. Review my latest Gold Price Outlook for a closer look at the near-term XAU/USD technical trading levels.
For a complete breakdown of Michael’s trading strategy, review his Foundations of Technical Analysis series on Building a Trading Strategy
Gold Trader Sentiment – XAU/USD Price Chart
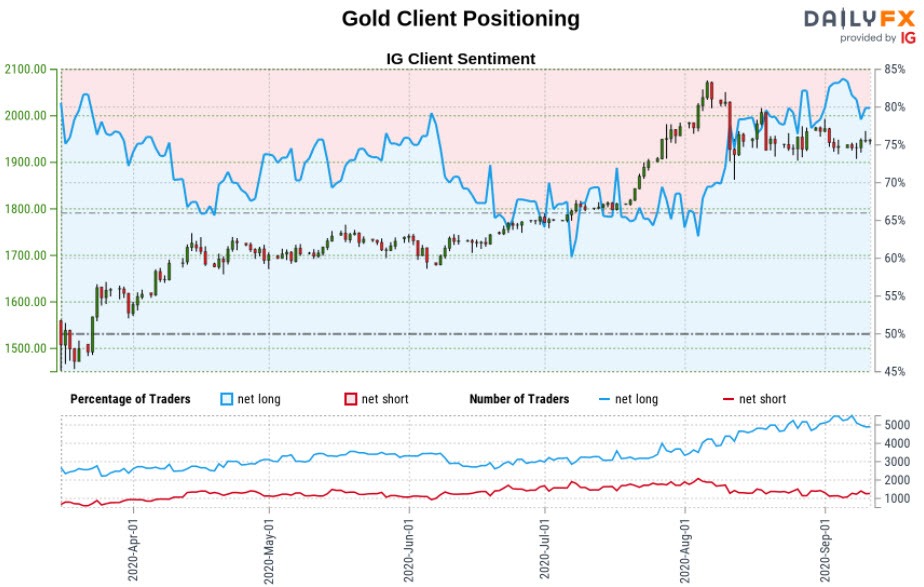
- A summary of IG Client Sentiment shows traders are net-long Gold- the ratio stands at +3.69 (78.69% of traders are long) – bearishreading
- Long positions are3.05% lower than yesterday and 10.24% lower from last week
- Short positions are3.28% lower than yesterday and 17.27% higher from last week
- We typically take a contrarian view to crowd sentiment, and the fact traders are net-long suggests Gold prices may continue to fall. Yet traders are more net-long than yesterday but less net-long from last week and the combination of current positioning and recent changes gives us a further mixed Gold trading bias from a sentiment standpoint.
| Change in | Longs | Shorts | OI |
| Daily | 1% | -3% | -1% |
| Weekly | 2% | -8% | -2% |
---
Previous Weekly Technical Charts
- Japanese Yen (USD/JPY)
- New Zealand Dollar (NZD/USD)
- Australian Dollar (AUD/USD)
- British Pound (GBP/USD)
- US Dollar (DXY)
- Canadian Dollar (USD/CAD)
- Written by Michael Boutros, Currency Strategist with DailyFX
Follow Michael on Twitter @MBForex


