


Technical Forecast for the Japanese Yen: Neutral
- Japanese Yen weakness has occurred alongside softer precious metals prices, higher sovereign bond yields, and stronger global equity markets. Or, a fairly typical performance during a risk-on environment.
- Several JPY-crosses are poised to test critical topside technical levels in the coming days (if they haven’t already attempted bullish breakouts in favor of more Yen weakness).
- The IG Client Sentiment Index suggests that the JPY-crosses have a decidedly mixed trading bias.

Yen Continues to Track Risk Trends
The Japanese Yen had a poor week as the calendar churned into the middle of August, with every JPY-cross (save NZD/JPY, which was grappling with news of a coronavirus outbreak hitting Auckland) posting gains. But the losses the Yen has endured shouldn’t be all that surprising; after all, as a low yielding, safe haven currency, it does well during times of market duress.
The exact opposite environment is transpiring as government bond yields tick higher alongside stronger equity markets and weaker precious metals prices. If Yen weakness is to continue moving forward, it will require further gains by bond yields (particularly US Treasuries) as well as weakness in precious metals – neither of which are a safe bet considering the fundamental backdrop supporting negative real yields.
USD/JPY RATE TECHNICAL ANALYSIS: DAILY CHART (August2019 to August 2020) (CHART 1)
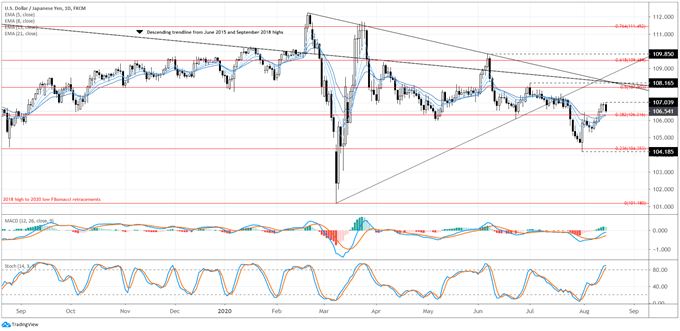
USD/JPY rates finished the week higher, but not before carving out a bearish evening star candle cluster over the final three trading days of the week. While Slow Stochastics have reached overbought territory, daily MACD remains below its signal line, concurrent with USD/JPY rates carving out a ‘lower high’ thus far in August relative to what was seen in June or July. Traders shouldn’t rule out more weakness, if only to retrace recent gains. Otherwise, the second half of August typically caters to relatively calmer trading conditions that portend to range trading over breakouts.
IG Client Sentiment Index: USD/JPY RATE Forecast (August 14, 2020) (Chart 2)
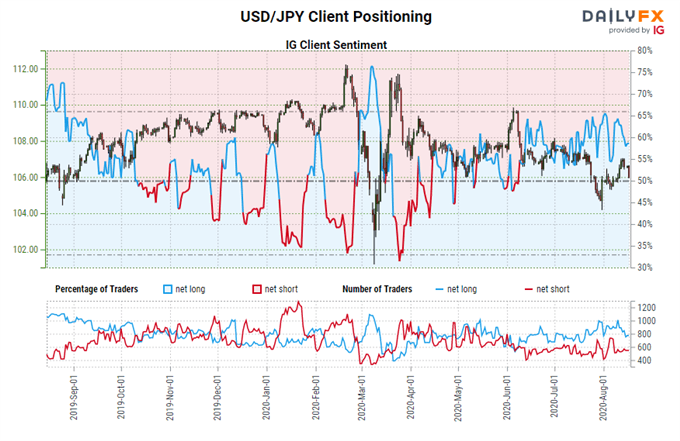
USD/JPY: Retail trader data shows 57.88% of traders are net-long with the ratio of traders long to short at 1.37 to 1. The number of traders net-long is 12.55% lower than yesterday and 7.66% lower from last week, while the number of traders net-short is 12.43% higher than yesterday and 25.10% lower from last week.
We typically take a contrarian view to crowd sentiment, and the fact traders are net-long suggests USD/JPY prices may continue to fall.
Positioning is less net-long than yesterday but more net-long from last week. The combination of current sentiment and recent changes gives us a further mixed USD/JPY trading bias.
EUR/JPY RATE TECHNICAL ANALYSIS: WEEKLY CHART (MARCH 2016 to AUGUST 2020) (CHART 3)
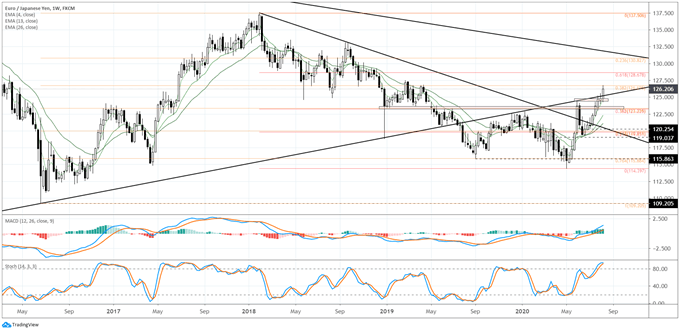
The EUR/JPY rate weekly chart is bullish, insofar as the rising trendline from the September 2012, July 2016, and January 2019 has been retaken after last week’s gains. The former support had proven formidable resistance since late-2019, and once again capped price action this past June. Among the JPY-crosses, EUR/JPY rates retain the most bullish long-term technical structure, and are best positioned to weather a pullback should momentum fade in the second half of August.
IG Client Sentiment Index: EUR/JPY Rate Forecast (August 14, 2020) (Chart 4)
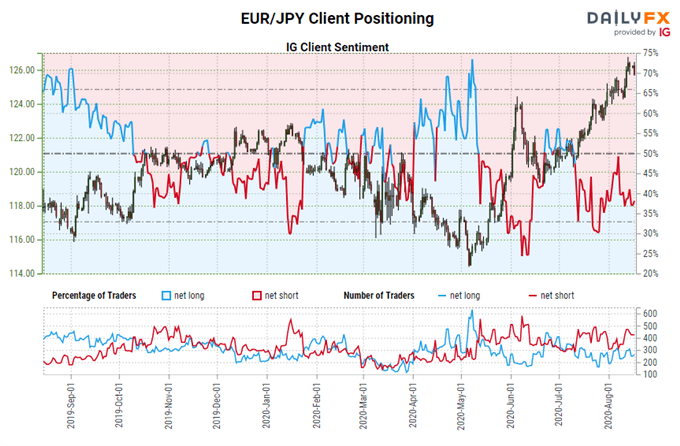
EUR/JPY: Retail trader data shows 39.82% of traders are net-long with the ratio of traders short to long at 1.51 to 1. The number of traders net-long is 4.68% higher than yesterday and 5.72% lower from last week, while the number of traders net-short is 14.53% higher than yesterday and 19.44% higher from last week.
We typically take a contrarian view to crowd sentiment, and the fact traders are net-short suggests EUR/JPY prices may continue to rise.
Traders are further net-short than yesterday and last week, and the combination of current sentiment and recent changes gives us a stronger EUR/JPY-bullish contrarian trading bias.
GBP/JPY Technical Analysis: Daily Rate Chart (August 2019 to August 2020) (Chart 5)
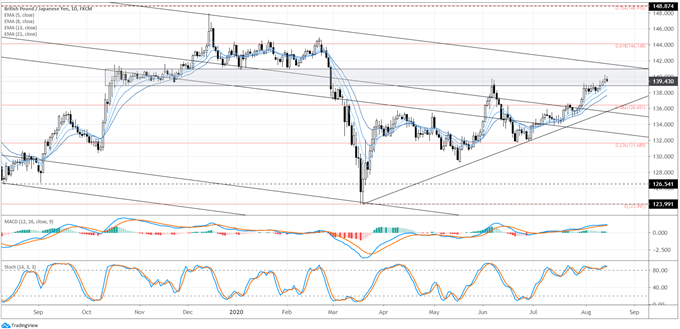
GBP/JPY rates have rallied into a familiar band of dynamic support and resistance in recent months, with the area between 138.85 and 140.85 proving to cause consternation for traders on several occasions since October 2019. A market environment defined by reduced volatility may seem supportive for GBP/JPY rates, but in context of the calendar, it is more of a sign of reduced market participation. Given the lighter calendar forth coming as well as the typical late-August swoon in trading volumes, it may prove difficult for GBP/JPY rates to stage a meaningful breakout opportunity.
IG Client Sentiment Index: GBP/JPY Rate Forecast (August 14, 2020) (Chart 6)
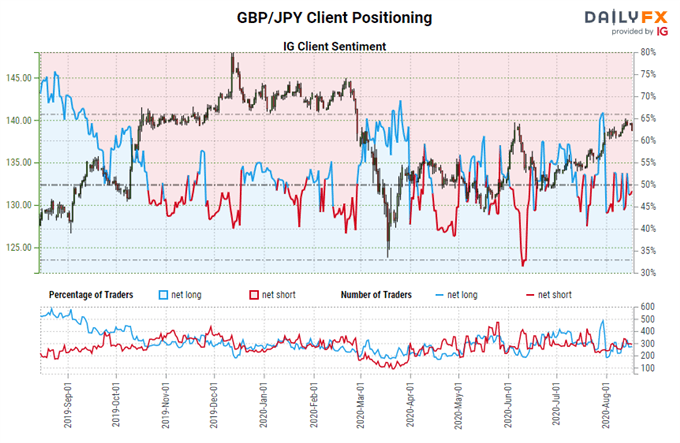
GBP/JPY: Retail trader data shows 47.12% of traders are net-long with the ratio of traders short to long at 1.12 to 1. The number of traders net-long is 3.92% lower than yesterday and 3.89% higher from last week, while the number of traders net-short is 6.78% lower than yesterday and 14.58% higher from last week.
We typically take a contrarian view to crowd sentiment, and the fact traders are net-short suggests GBP/JPY prices may continue to rise.
Positioning is less net-short than yesterday but more net-short from last week. The combination of current sentiment and recent changes gives us a further mixed GBP/JPY trading bias.
AUD/JPY Technical Analysis: Daily Rate Chart (August 2019 to August 2020) (Chart 7)
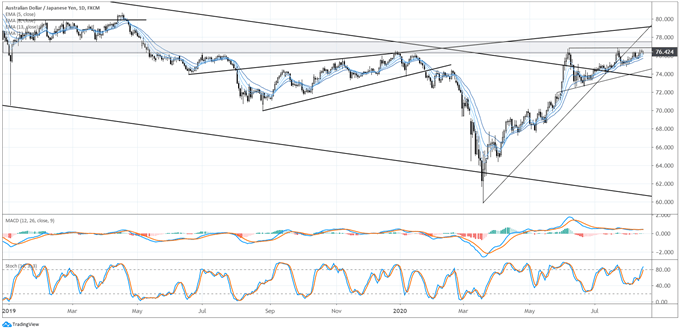
AUD/JPY rates have been consolidating in an ascending triangle since the beginning of June, and have found themselves once more capped by a familiar zone: the dynamic support and resistance band in the 76.30 to 77.55 area, which has proven itself a nuisance to traders going back to January 2019. To this end, with the uptrend from the coronavirus pandemic low now broken, momentum has proven weaker in AUD/JPY rates. As is the case with the other JPY-crosses mentioned in this report, the calendar does not cater to high volatility or increased trading volumes, making the probability of a significant move through this dampened for the time being.
IG Client Sentiment Index: AUD/JPY Rate Forecast (August 14, 2020) (Chart 8)

AUD/JPY: Retail trader data shows 37.66% of traders are net-long with the ratio of traders short to long at 1.66 to 1. The number of traders net-long is 2.86% higher than yesterday and 20.35% lower from last week, while the number of traders net-short is 2.05% higher than yesterday and 7.58% higher from last week.
We typically take a contrarian view to crowd sentiment, and the fact traders are net-short suggests AUD/JPY prices may continue to rise.
Positioning is less net-short than yesterday but more net-short from last week. The combination of current sentiment and recent changes gives us a further mixed AUD/JPY trading bias.

--- Written by Christopher Vecchio, CFA, Senior Currency Strategist


