


US Dollar Technical Price Outlook: DXY Weekly Trade Levels
- US Dollar technical trade level update – Daily & Intraday Charts
- USD rebounds off uptrend slope / Fibonacci support - second week advance
- DXY eyes initial resistance targets- risk for exhaustion while below 98.50
The US Dollar rallied more than 0.4% this week with DXY marking the second consecutive weekly advance. The rally takes the index nearly 2% off the monthly lows with the rally now eyeing initial resistance hurdles just higher. These are the updated technical targets and invalidation levels that matter on the US Dollar Index (DXY) weekly price chart. Review my latest Strategy Webinar for an in-depth breakdown of this Dollar trade setups and more.
US Dollar Index Price Chart – DXY Weekly
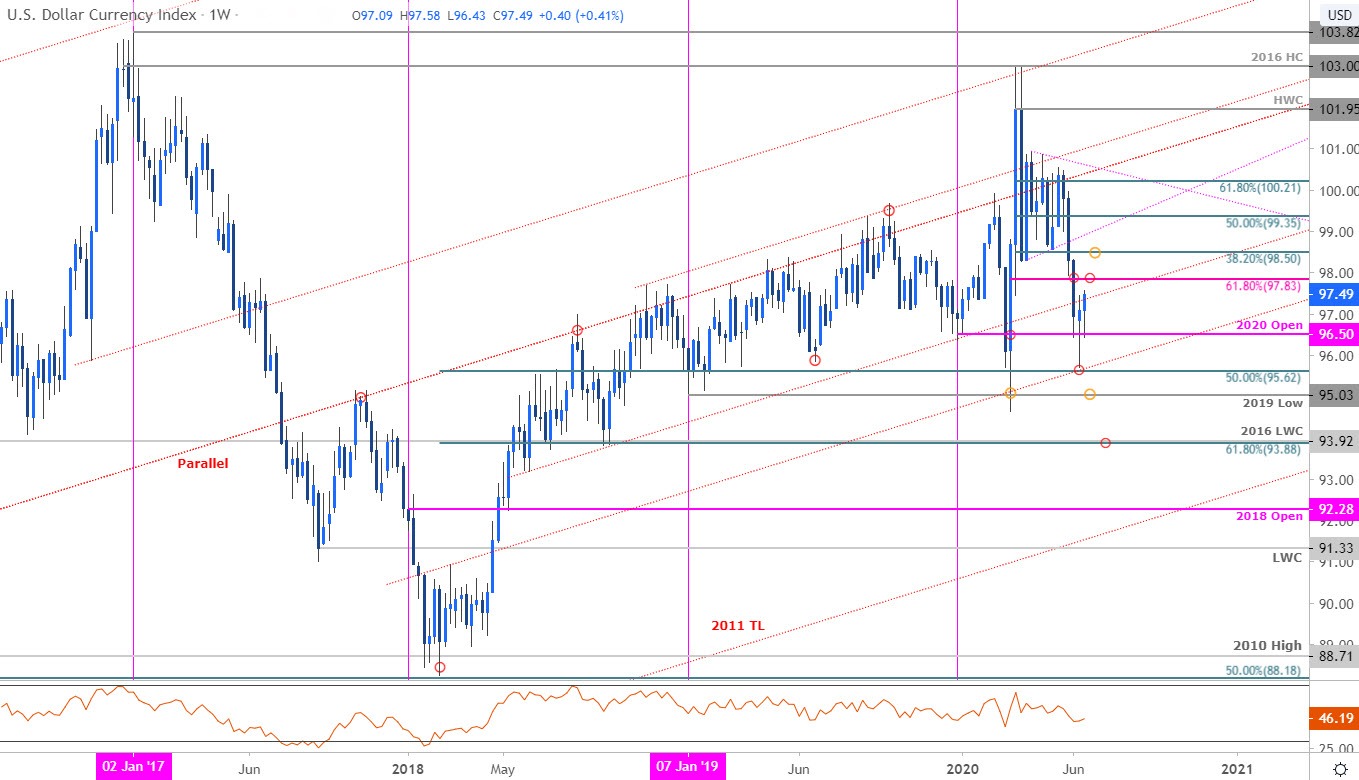
Chart Prepared by Michael Boutros, Technical Strategist; US Dollar Index on Tradingview
Notes: In last month’s US Dollar Weekly Price Outlook noted that DXY had, “broken below a multi-week consolidation / the May opening-range lows and keeps the focus lower heading into June.” The index sold-off more than 2% into the open of the month before rebounding just pips from the 50% retracement of the 2018 advance at 95.62 (low registered at 95.72). Note that the index failed to close below yearly-open support at 96.50 with weekly momentum holding above the 40-threshold.
The recovery is poised to mark its second consecutive weekly advance with the rebound taking DXY back towards the 61.8% Fibonacci retracement of the yearly range at 97.83- Look for initial resistance there. Ultimately, the near-term rally remains vulnerable while below the 38.2% retracement of the March decline at 98.50 with a break of the lows exposing subsequent support objectives at the 2019 low at 95.03 and the 61.8% retracement / 2016 low-week close at 93.88/92(critical).
For a complete breakdown of Michael’s trading strategy, review his Foundations of Technical Analysis series on Building a Trading Strategy
Bottom line: A rebound off confluence support has fueled a rally in the Dollar Index with the recovery now eyeing initial resistance targets. From a trading standpoint, look to reduce long-exposure / raise protective stops on a stretch towards 97.83 & 98.50- both regions of interest for possible topside exhaustion IF reached. Review my latest US Dollar Price Outlook for a closer look at the near-term DXY technical trading levels.

Key US Data Releases
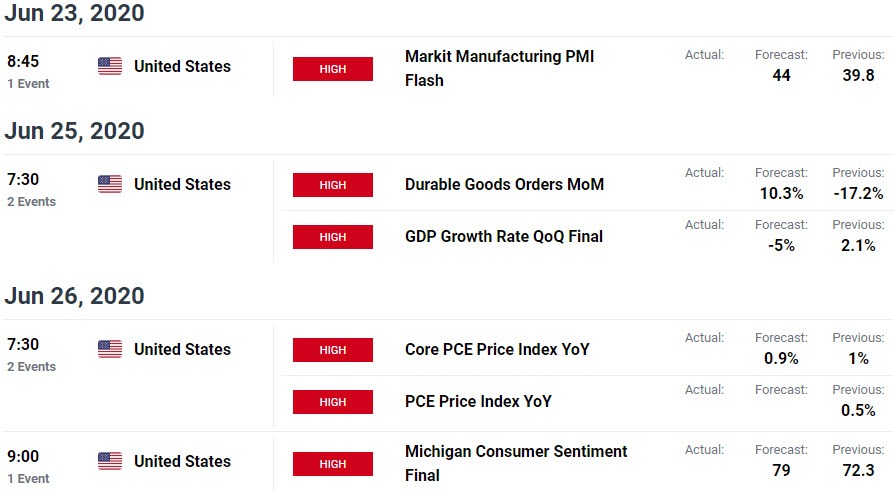
Economic Calendar - latest economic developments and upcoming event risk.
Previous Weekly Technical Charts
- Canadian Dollar (USD/CAD)
- Gold (XAU/USD)
- New Zealand Dollar (NZD/USD)
- Crude Oil (WTI)
- Australian Dollar (AUD/USD)
- British Pound (GBP/USD)
- Japanese Yen (USD/JPY)

--- Written by Michael Boutros, Technical Strategist with DailyFX
Follow Michael on Twitter @MBForex


