


GBP/USD, EUR/GBP and GBP/NZD Prices, Charts and Analysis:
- GBP/USD breaking to week low.
- EUR/GBP short-term rebound.
- GBP/NZD fading lower but positive for the week.
UK Weekly Look Ahead Webinar – Monday April 6 at 11:30 GMT (12:30 UK)
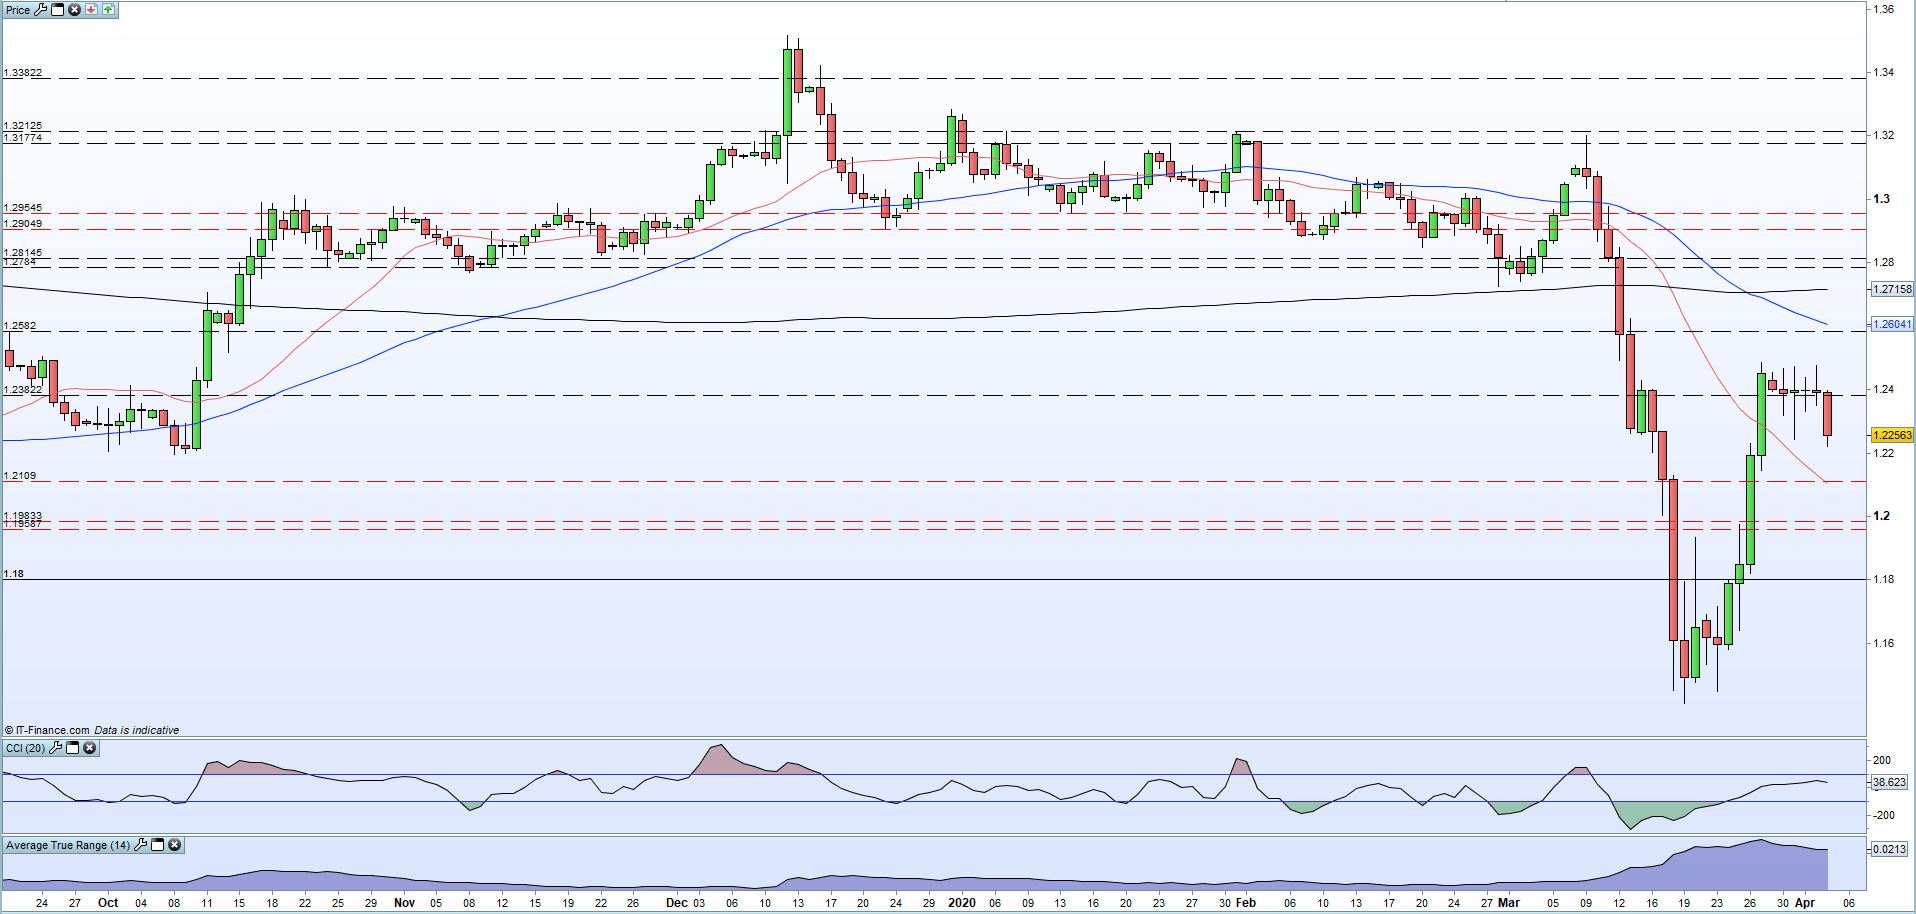
GBP/USD – Broken Weekly Low Opens Up Further Downside
Cable has given back all of this week’s gains and is now set to test the low of last Friday’s bullish engulfing candle at 1.2142, primarily due to US dollar strength. Below here the 20-day moving average currently sits at 1.2100, where big figure support may also come into play, although this may not last. GBP/USD chart also shows a bearish-cross – 50-dam through the 200-dma - made at the end of last week, another negative signal. Recent tops between 1.2480 and 1.2490 should cap any upside in the short-term.
GBP/USD Daily Price Chart (September 2019 – April 3, 2020)
For all market moving data and events, see the DailyFX Calendar.
| Change in | Longs | Shorts | OI |
| Daily | 3% | -7% | -3% |
| Weekly | 4% | -10% | -5% |
EUR/GBP Respecting Fibonacci Retracement
The recent EUR/GBP downtrend has been halted, in the near-term at least, by the 61.8% Fibonacci retracement level at 0.8747, and this may hold in the week ahead. The chart shows a golden cross – 50-dma up through the 200-dma – a positive signal, while the CCI indicator shows the market in oversold territory. The pair need to break and close above Thursday’s 0.8848 high print before the 50% retracement level at 0.8891 is opened up. The pair of recent lows just below 0.8747 should add support to the 61.8% Fibonacci level.
EUR/GBP Daily Price Chart (September 2019 – April 3, 2020)


GBP/NZD Continues to Build Solid Base
A positive week that saw GBPNZD break further higher and hitting the March 19 spike high 2.1016 three days in a row. This level has seemingly capped short-term upside and the pair need to convincingly break and close above here before they can push further ahead. Price action has seen several higher lows made over the last three weeks and this should stem any sell-off all the way back down to the 2.0450 to 2.0500 zone. The pair trade comfortably above all three moving averages, although the CCI suggests buyer caution with the indicator solidly in over bought territory.
GBP/NZD Daily Price Chart (September 2019 – April 3, 2020)

For all market moving data and events, see the DailyFX Calendar.
Traders may be interested in two of our trading guides – Traits of Successful Traders and Top Trading Lessons – while technical analysts are likely to be interested in our latest Elliott Wave Guide.
What is your view on Sterling (GBP)– bullish or bearish?? You can let us know via the form at the end of this piece or you can contact the author via Twitter @nickcawley1.


