


GBP/USD WEEKLY TECHNICAL FORECAST: POUND STERLING SURGES AS CONSERVATIVES WIN UK ELECTION BUT 1.3500 LEVEL REMAINS AN OBSTACLE
- GBP/USD prices have skyrocketed 13% higher from year-to-date lows as PM Boris Johnson steers the UK closer to delivering Brexit with a conservative majority in British Parliament
- The Pound Sterling could continue to rise on the back of increased Brexit clarity following the UK general election, but GBP/USD charts may struggle to eclipse the 1.3500 price level
- GBP/USD is expected to be the most active major currency pair next week judging by implied volatility derived from forex options contracts
The British Pound soared last week on news that conservative MPs swept last week’s general election to gain 46 seats and a majority in Parliament, which is expected to break the longstanding gridlock and provide a clear path to Brexit before the January 31, 2020 deadline.
Spot GBP/USD prices have potential to keep climbing on hopes that ‘Brexit paralysis’ will no longer cripple the UK economy, but the Sterling could have trouble topping its fresh 2019 high of 1.3516.
GBP/USD PRICE CHART: WEEKLY TIME FRAME (JULY 2017 TO DECEMBER 2019)

The 1.3500 now appears to be a clear resistance level that may keep a lid on further upside in the British Pound. This technical level is roughly underpinned by 61.8% Fibonacci retracement of spot GBP/USD’s trading range since printing its April 2018 high.
GBP/USD prices may churn higher, however, as the MACD indicator illustrates bullish momentum gaining pace. Likewise, the expanding width of the 2-standard deviation Bollinger Band could, statistically speaking, enable further upside potential.
GBP/USD PRICE CHART: DAILY TIME FRAME (AUGUST 2019 TO DECEMBER 2019)

Shifting focus to a daily GBP/USD chart reveals the healthy uptrend etched out by the cable since its September 03 swing low. On that note, the positively sloped trendline connecting the October 09, November 26 and December 12 lows could offer buoyancy to the British Pound.
| Change in | Longs | Shorts | OI |
| Daily | 3% | -7% | -3% |
| Weekly | 4% | -10% | -5% |
Similarly, the 23.6% Fibonacci retracement level roughly around the 1.3150 could provide confluent support to spot GBP/USD prices. A drift lower could be in the cards after a hard rejection at the 1.35 handle and considering the relative strength index is running red-hot, which suggests that the recent rally in the Pound Sterling could be a bit overdone.
BRITISH POUND VOLATILITY INDEX (BPVIX) & GBP/USD PRICE CHART: DAILY TIME FRAME (DECEMBER 2018 TO DECEMBER 2019)
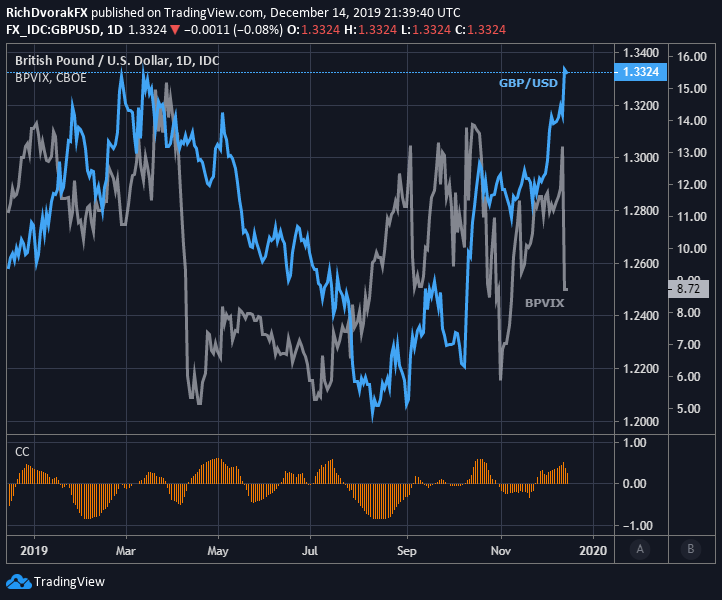
That said, risk of another hung Parliament is now in the rearview mirror and is reflected by a plunge in the British Pound volatility index (BPVIX). The dropping correlation coefficient between spot GBP/USD prices and BPVIX suggests that the British Pound could rise further on the back of reduced uncertainty on the horizon.
Keep Reading: US Dollar Outlook as FX Volatility Rises from Extreme Lows – USD Levels to Watch
-- Written by Rich Dvorak, Junior Analyst for DailyFX.com
Connect with @RichDvorakFX on Twitter for real-time market insight


