


British Pound Forecast Talking Points:
- GBPUSD eased back for the first time in four weeks following an incredible 6.5% climb
- Consolidation after an extended run is a familiar pattern across all Pound crosses
- While the technical settings are all in place for a reversal, traders would do well to respect Brexit
What do the DailyFX analysts expect for the Euro through the fourth quarter of 2019? What about the other majors, indices and commodities? Download our free Q4 Forecasts - Fundamental and Technical on the DailyFX Free Trading Guides Page.
Technical Forecast for British Pound: Bearish
In a broader market where there is very limited momentum to be found beyond well-established range boundaries – such as with EURUSD and the Dow – the British Pound is a very prominent exception. Through the month of October, we have witnessed a robust rally that has cleared out any semblance of even medium-term confines. What’s more, it isn’t at all mysterious why this currency has been able to overcome the gravity of the broader financial system. Brexit has driven the currency to extremes not just in the past weeks and months, but even in the context of decades. The GBPUSD swing low through the start of September brought us back to the three-decade low that we hit post-Brexit vote in late 2016.
This situation creates a particularly difficult trading environment. On the one hand, the speculative rank is painfully dependent on the tumultuous headlines. What’s more, if you’ve been keeping track of this complicated theme, we have seen yet another confounding flip in conditions this past week as UK’s Parliament delayed the Prime Minister’s withdrawal agreement bill, leading the leader to call for a snap election in December. That may buy some time with a deadline for a major decision pushed back approximately 7 weeks, but that depends on whether the EU grants such an extension. Headlines can change rapidly, and thereby so too can direction. Another issue that springs up is a consistently heightened state of volatility. That doesn’t mean GBPUSD and the Pound will always be moving violently, but it can do so with little warning.
In such volatile conditions, technical boundaries become more suspect – whether we are treating them as catalysts or boundaries (continuation or reversal). With the benchmark Cable, there aren’t too many major technical boundaries in sight thanks to the enormous rally of the past month. Instead, taking stock of the shift in pace can offer guidance whether another burst of headlines kicks in or we are left to a fundamental gap. On the daily chart of GBPUSD, the moderate retreat of the past week can stand as a mere pause in a broader bull trend; but recharging such an atypical rally will take significant conviction. Alternatively, the fading highs on a shorter time frame chart (such as the 2-hour) can turn into a head-and-shoulders pattern. Given the circumstances, I would put much more weight in the break of the 200-day moving average around 1.2700 rather than the short H&S neckline at 1.2800.
Chart of GBPUSD with 50-Day and 200-Day Moving Averages (Daily)
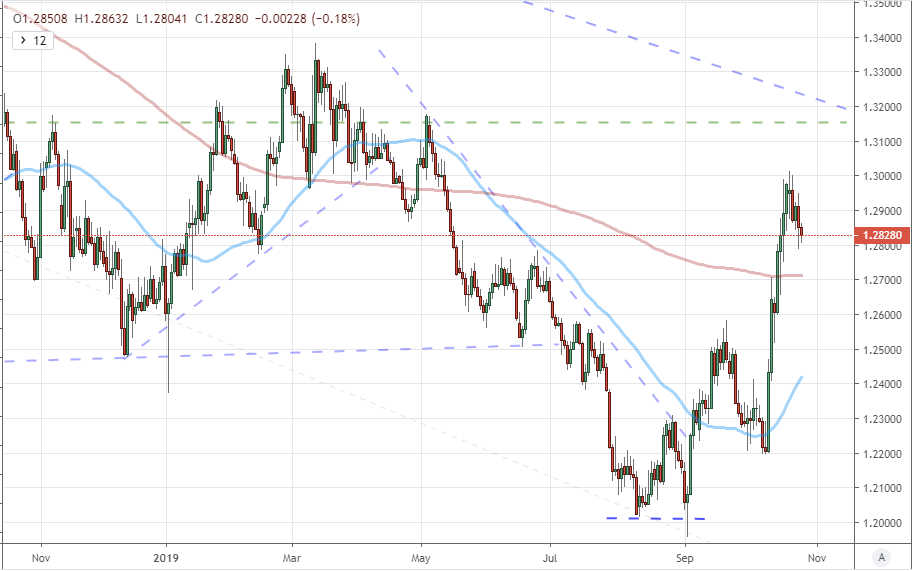
Chart created with the TradingView Charting Platform
Moving back up to the daily time frame, it is worth putting into context how extraordinary the rally has been through October. In terms of pace, the 20day rate of change hit its highest level since January 2018 – when the pair made a blow off top. In terms of sheer activity – stripping out the directional component – the average true range over the same period (equivalent to a trading month), hit comparable levels to March which were extremely active but lacking for bearing. More directly relatable in structure was that same January 2018 period with the acceleration following an already prominent climb in the preceding months.
Chart of GBPUSD with 20-Day ATR Purple and 20-Day Rate of Change in Red (Daily)
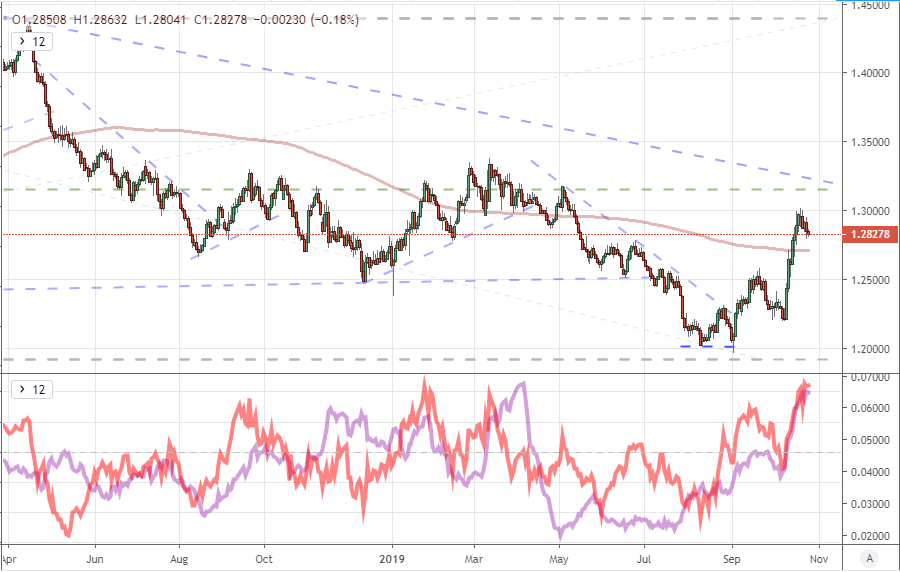
Chart created with the TradingView Charting Platform
There is a certain reversal-to-norms quality that underlies the market. Extremely volatile conditions revert to more ‘normal’ activity levels that reflect the liquidity and interest behind the asset in question. The volatility is definitely extreme and was prone to moderate as it did this past week unless there was a constant stream of incredible headlines. Yet, as volatility tempers, the draw on such a sharp trend is more likely prone to snap back. Looking at the historical comparison of spot Cable relative to a 12-week moving average (equivalent of 3 month), we find the market extended its further charge from this average since July 2010. The preceded a quick reversal, but don’t assume this has to happen again.
Chart of GBPUSD with Disparity Between Spot and 12-Week Moving Average (Weekly)

Chart created with the TradingView Charting Platform
Attempting to take some of the Dollar out of the equation for a more holistic Sterling technical view is a good idea heading into the new trading week with US 3Q GDP and the FOMC rate decision on tap. Looking at an equally-weighted Pound index we find much of the same technical pattern is in play. What’s more, on this perspective, there is range resistance and the midpoint of the pre- and post-Brexit decision range all within easy reach of our recent swing high. This is indicative of the general stance of tradable Sterling crosses, but shouldn’t be considered tactical levels to work with. Meanwhile, the CME’s Pound implied volatility index has dropped to the lowest since August, which would suggest a high probability of following the ‘path of least resistance’. Beware, however, the ‘volatility of volatility’ is very high.
Chart of Equally-Weighted Pound Index with Pound Volatility Index (Daily)

Chart created with the TradingView Charting Platform
Among the many Sterling crosses, EURGBP is particularly interesting. Fundamentally, both currencies have exposure to the Brexit, but practically, we have seen the Sterling absorb most of the activity this past month. The momentum here has been just as extreme as with GBPUSD. The technical support just below 0.8600 is particularly remarkable as it represents a trendline of the progressively higher lows since the Brexit impact first registered.
Chart of EURGBP (Daily)
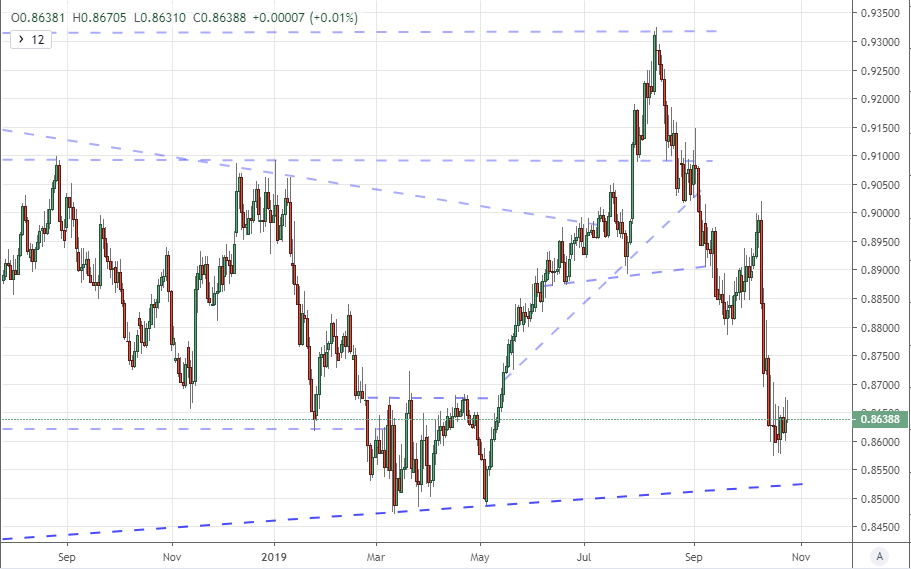
Chart created with the TradingView Charting Platform
A far-less common cross to consider is the same one that I point out last week when I evaluated the circumstances for the Australian Dollar: GBPAUD. The pair clearly enjoyed the Sterling’s recent windfall, but it has also been on the rise for three consistent years in a broad channel. We have just this past week hit the top of that channel which happens to now coincide with the range extremes for the past six years of trading around 1.9100. If indeed the Sterling is going to see volatility ease and its buoyancy along side it, there are few pairs with more pronounced technicals that would have supported the shift.
Chart of GBPAUD (Weekly)

Chart created with the TradingView Charting Platform
See how retail traders are positioned in Gold along with other key FX pairs, indices and oil on the DailyFX Sentiment page.
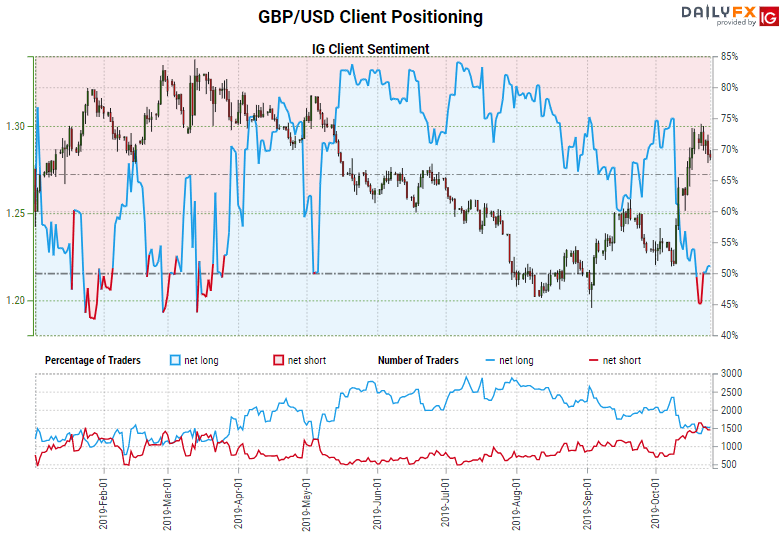
Taking into consideration underlying speculative exposure, it is clear that there are still some significant extremes to work off. From the longer-duration futures traders’ exposure measured through the COT’s net speculative positioning data, we find that the record-breaking short is still being worked off and far from neutral. Yet, with price holding proximity to multi-decade lows, it is less likely that the masses pull their exposure so readily. On the shorter end of the trading curve, retail interests just recently flipped to a net short position this past week. It is not an extreme disparity, but it is unusual for the habits of traders behind GBPUSD to pursue any lasting drop. That is a rare habit among a much more active market participant type to think of the medium-term and volatility potential over technical opportunism and the path of least resistance.
Chart of Net Speculative Positioning in Aggregate GBPUSD Futures from CFTC Report (Weekly)
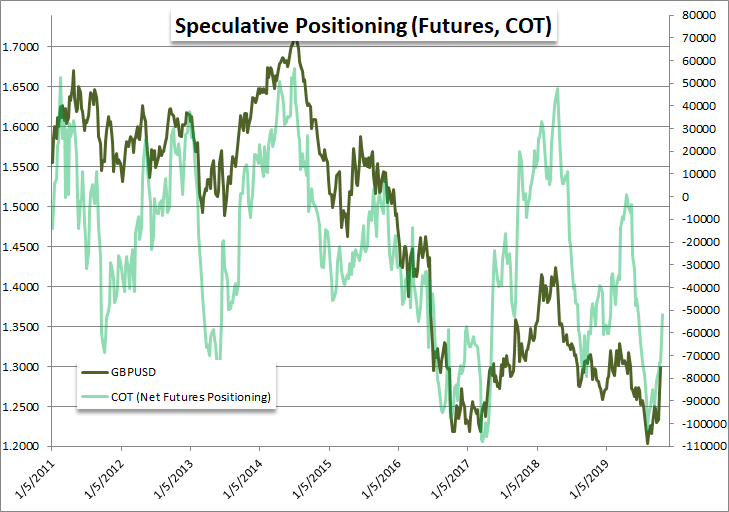
Chart of Retail Trader Positioning from IG Clients (Daily)
.


